Download
1 / 46
460 likes | 666 Views
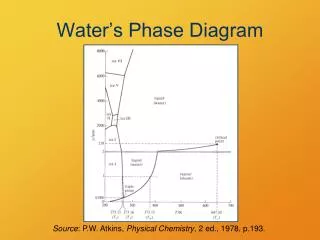
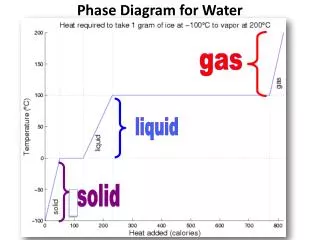
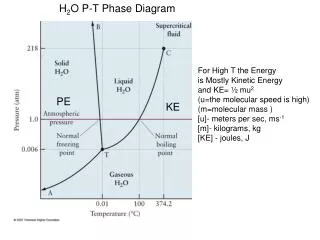
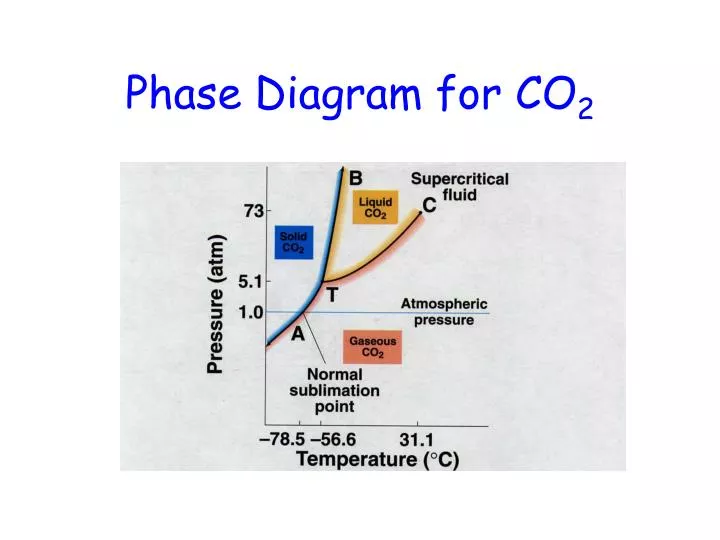
Phase Diagram for CO 2. Phase Diagram for H 2 O. Vapor pressure Surface tension Viscosity Adhesive/cohesive forces Capillary action. Density Compressibility Diffusion Evaporation. The Liquid State. Density of Ice and Water. Compressibility. Surface Tension.

E N D
Vapor pressure Surface tension Viscosity Adhesive/cohesive forces Capillary action Density Compressibility Diffusion Evaporation The Liquid State
Trouton’s Rule An interesting and useful “approximation: • Says that the ratio of the heat of vaporization to the boiling point is (roughly) constant DHvap/Tb.p. ~ 88 J/mol • Boiling point of cyclohexane is 69°C. Therefore, DHvap = (69 + 273)(88) ~ 30 kJ/mol which is within 2-3% of the experimental value • Works well for unassociated liquids and gives useful information about degree of association.
Trouton’s Rule Unassociated (ideal) liquids, DHvap/Tb.p. ~ 88 J/mol carbon tetrachloride benzene cyclohexane Associated liquids, DHvap/Tb.p. > 88 J/mol water (110) methanol (112) ammonia (97) Association in the vapor state, DHvap/Tb.p. < 88 J/mol acetic acid (62) hydrogen fluoride (26)
Elevation of the normal boiling point Lowering of the normal freezing point Colligative Properties
Raoult’s Law • Nonvolatile solute in volatile solvent: p = p°Xsolvent p° - p = Dp = p°Xsolute • Elevation of the boiling point: DT = Kbpm • Depression of the freezing point: DT = Kfpm • Osmostic pressure: P = cRT
Super Slurper • “Slurper” molecules are polymers with hydrophilic ends that grab onto water molecules. • Sodium salt of poly(acrylic acid). • R-COO-, Na+
Elevation of the normal boiling point Lowering of the normal freezing point Colligative Properties
Another Estimate Problem • …. the lowest temperature your car radiator fluid could withstand and still remain fluid if your car radiator fluid was… VODKA! • Strategy/LOGIC
Osmosis/Osmotic Pressure Applications: • Treating industrial wastes • Pulp and paper manufacture • Reclamation of brackish/salt water • Sewage treatment • Electrodialysis • Many biological/ecological processes
Osmosis/Osmotic Pressure • DRIED PLUMS… “prunes” • Carrots • Eggs • Blood cells
Osmosis/Osmotic Pressure In dilute solutions: ∏V = n2RT = [g2/M2]RT ∏= cRT where c ~ mol/L Solubility of hemoglobin in water is 5.0 g/L Strategy/LOGIC? ∏ = 1.80 X 10⁻³ atm @ 25°C C = ∏ /RT = mol/L MW = [g/L]/mol/L] = g/mol
Example Estimate the “back pressure” needed to obtain pure water from sea water by “reverse” osmosis. Strategy/LOGIC ∏= cRT where c ~ mol/L
Van’t Hoff i-Factor • Colligative effects depend on number of particles. • Ionization and dissociation multiply colligative effects. • Association acts in theopposite sense.
Van’t Hoff i-Factor ∆T = iKbpm (boiling point elevation) ∆T = iKfpm (freezing point depression) ∏ = icRT (osmotic pressure)
Simple Distillation • Mixture of alcohol and water form a nearly ideal solution. • Use Raoult’s law to calculate the composition of the solution. • Use Dalton’s law to calculate the composition of the vapor above the solution • Vapor is “richer” in the more volatile component.
Distillation • Simple distillation… as recorded by Maxfield Parish in his freshman chemistry laboratory notebook. • Fractional distillation… on a laboratory scale of 1000mL/h • Separation of petroleum hydrocarbon mixtures on an industrial scale ~50,000 gal/d