Download

1 / 40

E N D
Quick review of last time~ In 2007, deaths of a large number of pet dogs and cats were ultimately traced to contamination of some brands of pet food. The manufacturer NOW claims that the food is safe, but before it can be released, an experiment to test whether the food is now safe for dogs and cats to eat must be conducted.
Quick review of last time~ • A group of 32 dog owners have volunteered their pets for this experimental study. Of the 32 dogs, 16 are poodles and 16 are German shepherds. The dogs will eat the assigned food for a period of 6 weeks. • We believe that because of differences in body size, the two different breeds may be affected differently by potential contaminants in the dog food. • Explainhow you would carry out a completely randomized experimentto see if the new food is safe for dogs to eat.
Remember: completelyrandomized experiment means NO BLOCKING ALLOWED!!! Completely* randomized experiment:What is the FIRST thing we do? Treatment 1: Dogs eat new food for 6 weeks Group 1: 16 dogs Group of 32 dogs RANDOM ASSIGNMENT Comparehealth of dogs, to be evaluated by veterinarian Treatment 2: Dogs eat “safe” food for 6 weeks Group 2: 16 dogs
Remember: you MUST explain how units were randomly assigned to treatment groups!!! • We will number the dogs from 01 to 32, then use a random number generator (or table) to select 16 dogs (ignoring repeated numbers) for treatment group 1 (new food from the company). The rest of the dogs will be placed in treatment group 2 (“safe” food). • AP Grading Criteria: If two knowledgeable statistics users read your description, will they use the same method to assign experimental units to treatments?
Of the 32 dogs, 16 are poodles and 16 are German shepherds (we believe different breeds may react differently to contaminants in the food). Explain the changes you would make to your previous design by incorporating blocking.
Randomized Block Experiment Group 1: 8 dogs Treatment 1 Dogs eat new food for 6 weeks RANDOM Block A: 16 poodles Compare health of dogs 32 dogs Treatment 2 Dogs eat “safe” food for 6 weeks Group 2: 8 dogs BLOCK BY BREED Treatment 1 Dogs eat new food for 6 weeks Group 3: 8 dogs RANDOM Block B: 16 German shepherds Compare health of dogs Treatment 2 Dogs eat “safe” food for 6 weeks Group 4: 8 dogs
One last major point: NEVER call your subjects a “random sample” unless you KNOW for a FACT that they really were a random sample of the population. With experiments, you are almost always dealing with VOLUNTEERS (think about it!) Treatment 1: Patient takes the new pill Group 1: 20 patients RANDOM ASSIGNMENT Group of 40 volunteers Comparenumbers of headaches… Control: Patient gets placebo Group 2: 20 patients
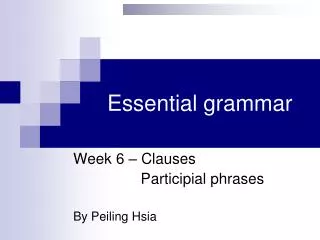
Matched pairs a special type of block design • pair up experimental units according to similar characteristics • randomly assign one to one treatment & the other automatically gets the 2nd treatment • Or have each unit do both treatments in random order (such as before/after, or a taste test with Coke/Pepsi) • the assignment of treatments is dependent
Treatment B Treatment A Next, randomlyassign one unit from a pair to Treatment A. The other unit gets Treatment B. Pairexperimental units according to specific characteristics. This is one way to do a matched pairs design – another way is to have each individual unit do both treatments (as in a taste test).
Treatment A Treatment B • Do not write: • If we flip “heads”, then ALLof the #1’s get treatment A (and ALL of the #2’s get treatment B)… • You must give each #1 (and #2) a fair chance of going either way. • In each pair, assign one unit the number “1” and the other the # “2”. • In each block (pair), we will flip a fair coin such that if the side of the coin facing up is… • “heads”, #1 will get treatment A (and #2 will get treatment B) • “tails”, #2 will get treatment A (and #1 will get treatment B) 1 2 1 2 1 2 1 2 Just make sure you flip a coin for EACH pair!
Displaying and Describing Categorical Data Chapter 3 grade level? color of hair types of cars gender
The Three Rules of Data Analysis The three rules of data analysis won’t be difficult to remember: • Make a picture— things may be revealed that are not obvious in the raw data. These will be things to think about. • Make a picture— important features of and patterns in the data will show up. You may also see things that you did not expect. • Make a picture— the best way to tell others about your data is with a well-chosen picture.
Launched: 31st May 1911Builders: Harland and Wolff, BelfastPort of Registry: LiverpoolPassengers Lost: 818 (62%)Crew Lost: 684 (77%)Total Lost: 1,502 (68%)
Frequency Tables: Making Piles • Records countsand category names.
Relative Frequency Tables • Percentages (proportions) instead of counts.
Both describe the distribution of a categorical variable. Distribution: name of categories and how frequently each occurs Frequency distribution Relative frequency distribution
this is a Violationof the “Area Principle” What do you see? When we look at each ship, we see the areataken up by the ship, instead of the lengthof the ship.
Bar Charts • A bar chart displays the distribution of a categorical variable, showing the counts for each category next to each other for easy comparison. • A bar chart stays true to the area principle. For bar charts (with categorical data), be sure to leave spaces between the bars!!!
Bar Charts • A relative frequency bar chart displays the relative proportion of counts for each category.
Pie Charts When you are interested in parts of the whole, a pie chartmight be your display of choice.
What Can Go Wrong? While some people might like the pie chart on the left better, it is harder to compare fractions of the whole, which a well-done pie chart does.
What Can Go Wrong? This plot of the percentage of high-school students who engage in specified dangerous behaviors has a problem. Can you see it? if you are making a pie chart with percentages (or proportions), make sure the percentages add up to 100%!!!
Class A contingency tableallows us to look at two categorical variables together. Survival marginal distributions
What percent of the people on the Titanic died? • What percent of the people were surviving crew? • *What percent of the survivors were First class? • *What percent of First class survived? 1490/2201 = 67.7% 212/2201 = 9.6% 203/711 = 28.6% 203/325 = 62.5%
A conditional distributionshows the distribution of one variable for just the individuals who satisfy some condition on another variable.
Conditional Distributions • The conditional distributions tell us that there is a difference in class for those who survived and those who perished. • Pie charts of the two distributions:
We see that the distribution of Class for the survivorsis differentfrom that of the non-survivors… so classand survivalareassociated(they are dependent).
The variables would be considered independentif the distribution of one variable were the same for all categories of the other variable. independent = no association dependent = association
A segmented bar chart displays the same information as a pie chart, but in the form of bars instead of circles. Segmented Bar Charts Proportion
The distributions for each gender are the same, so genderisindependentoflevel of education. (no association) Level of Education Here’s a look at gender versus level of education in the fictitious town of Podunk (home of Podunk University!) Gender *and not a college graduate
Podunk – Level of Education by Gender College Graduate College Graduate High School Graduate (but not college grad) High School Graduate (but not college grad) Gender is independentof level of education (no association) NotHigh School Graduate NotHigh School Graduate Male Female
In which region do the greatest number of people wear seatbelts?
The Midwesthas the smallestproportion of car drivers wearing seat belts (about 62%) where the SouthandWesthave the largestproportion(about 78- 80%). Overall, the bar chart shows that all four regions of the country have more than 60% of car drivers wearing seat belts. Note: we are using the word “proportion” (or “percentage”)… …NOT the word “number”
What Can Go Wrong? • Be sure to use enough individuals! • Do not make a report like “We found that 66.67% of the rats improved their performance with training. The other rat died.”
What Can Go Wrong? (cont.) • Don’t use unfair or silly averages~
we need data for next time! (average hair length)