Download
1 / 11
110 likes | 243 Views
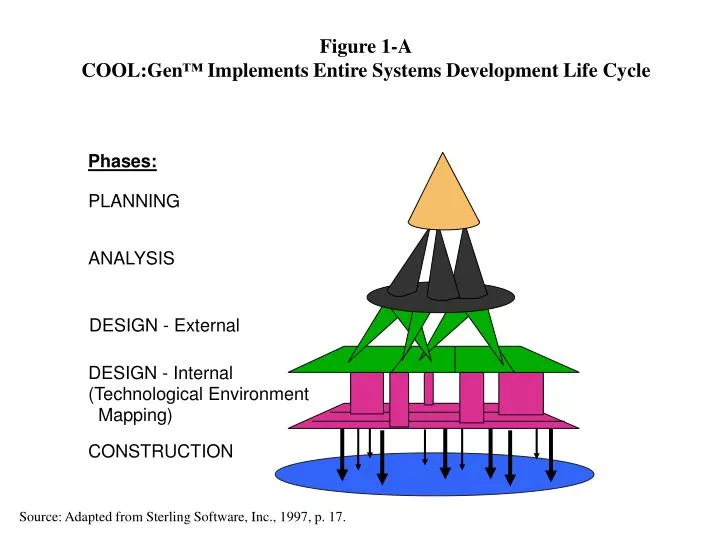
Figure 1-A COOL:Gen ™ Implements Entire Systems Development Life Cycle. Phases:. PLANNING. ANALYSIS. DESIGN - External. DESIGN - Internal (Technological Environment Mapping). CONSTRUCTION. Source: Adapted from Sterling Software, Inc., 1997, p. 17. Figure 1-B Cool:Gen™ Tool Outputs.

E N D
Figure 1-ACOOL:Gen™ Implements Entire Systems Development Life Cycle Phases: PLANNING ANALYSIS DESIGN - External DESIGN - Internal (Technological Environment Mapping) CONSTRUCTION Source: Adapted from Sterling Software, Inc., 1997, p. 17.
Figure 1-BCool:Gen™ Tool Outputs Organizational Hierarchy Diagram High-level Activity Hierarchy Diagram Structure Charts Planning Planning Entity Relationship Diagram Activity Hierarchy Diagram Activity Dependency Diagrams Process Action Diagrams Analysis Procedure Action Diagrams Graphic User Interface Design Generated Code (COBOL or C++) Data Definition Language (e.g., for Oracle Database Management System) Construction
Figure 2Systems Analysis Stage of Systems Development Life Cycle:Traditional Information Engineering Analysis Tasks ERD Data Analysis PLD,ELC Interaction Analysis Design Phase Activity Analysis AHD, ADD Legend: ERD - Entity Relationship Diagram AHD - Activity Hierarchy Diagram ADD – Activity Dependency Diagram PLD - Process Logic Diagramming ELC – Entity Life Cycle Diagramming
Figure 3Analysis Tasks Incorporating REA Interaction Modeling AHD, ADD Activity Analysis REA Preliminary Interaction Analysis 1 ERD PLD, ELC Formal Interaction Analysis 2 Design Phase Data Analysis Legend: AHD - Activity Hierarchy Diagram ADD - Activity Dependency Diagram ERD - Entity Relationship Diagram PLD - Process Logic Diagramming ELC - Entity Life Cycle Diagramming
Figure 4Template For Modeling An Enterprise:A Collection of Template Processes Cash Disbursements Cash Receipts $ $ Suppliers of Resources Customers Buy Products/Services Enterprise Converts Resources AMP: Raw Materials Supplies Human Resources Financial Resources Fixed Assets Conversion: Operations Job Costing MSC: Marketing Sales Collection
Figure 5 REA Model of A Business Event: The Event and Surrounding Resource/Agents/Location Location Internal Agent Event Resource External Agent • What happened (Event)? • Who was involved (Agents)? • What resources were involved (Resource)? • Where did it occur (Location)?
Figure 6REA Interaction Model for a MSC Process: Two Events and Surrounding RALs Department Salesperson Sell goods Inventory Customer Receive cash payment Cash Cashier
Figure 7-AActivity Hierarchy Diagram: Example of Partial Decomposition
Figure 7-BActivity Hierarchy Diagram: Elementary Processes of AMP of Fixed Assets
Figure 8Activity Dependency Diagram for “Acquire and Pay for Fixed Assets” Sequential dependency Mutually exclusive dependency Parallel dependency
Figure 9 ERD for a “Sell Goods” Event Agents Location/Resource “Sell Goods” Event