Download
1 / 31
310 likes | 416 Views
The impacts of avian flu on the poultry-related stocks listed in the US public stock markets. Wei Huang David Bessler Texas A&M University, College Station September 28, 2008. Outline of Presentations. Introduction Theoretical analysis Empirical methodologies Empirical results

E N D
The impacts of avian flu on the poultry-related stocks listed in the US public stock markets Wei Huang David Bessler Texas A&M University, College Station September 28, 2008
Outline of Presentations • Introduction • Theoretical analysis • Empirical methodologies • Empirical results • Conclusions
Research Objectives This study plans to explore the impacts of recent outbreaks of avian influenza (AI) on security values of poultry-related firms listed in the United States (US) stock market, especially the different impacts between upstream and downstream poultry-related firms, and between AI outbreaks in US and out of US.
Previous Studies • Explore possible effects of AI outbreaks on trade, and industrial, regional or national economy (Djunaidi et al., 2007; Brown et al., 2007; Paarlberg et al., 2007) • Study influences of BSE outbreaks on stock prices in the meat and other related industries in the United Kingdom (UK) and the United States. (Henson et al, 2002; Jin and Kim, 2008)
Theoretical Analysis: demand - supply analysis for poultry meat(egg)/cooked food of a producer
Pu S1u P2u P1u D1u D2u Qu Q1u Q2u Demand and supply for a producer’s poultry meat(eggs) before and after AI outbreaks outside US
Pu S2u S1u P1u P2u D1u D2u Qu Q2u Q1u Demand and supply for a producer’s poultry meat(eggs) before and after AI outbreaks inside US
Pdus S2dus S1dus ΔSdus P1dus D1dus Q2dus Q1dus Qdus Demand and supply for a producer’s poultry cooked food before and after AI outbreaks outside US
Price decease effect > quantity decrease effect Price decease effect < quantity decrease effect Pdus S1dus S2dus ΔSdus P1dus D1dus Q1dus Q2dus Qdus Pdus S2dus S1dus ΔSdus P1dus D1dus Q2dus Q1dus Qdus Demand and supply for a producer’s poultry cooked food before and after AI outbreaks inside US
Location of AI outbreaks Firm type Stock price behavior Outside the country Poultry meat/eggs producers Stock price Inside the country Poultry meat/eggs producers Stock price Outside the country Poultry food producers Stock price Inside the country Poultry food producers Input price effect > input quantity effect Stock price Input price effect < input quantity effect Stock price Summary on theoretical impacts of AI outbreaks on poultry-related stock prices
Empirical Methodologies: historical decomposition
Historical decomposition • Here we write the time series stock price vector X in its moving average form (MAR) • Where the vector X is written as an infinite series of orthogonalized innovations, et-i. From Equation (3), we can calculate a historical partition of the vector X at any date T+k into information available at time t = T and information which is revealed at period t = T+1, T+2, … , T+k. We can write the vector X at period T+k as:
How to obtain MAR for Historical decomposition? • The VAR can be illustrated using a set of m variables each measured at time t; t= 1, 2, 3,…,T: • xt' = (x1t, x2t, x3t, . . . , xmt); t= 1,2,3,…,T . • This vector, xt ,can be written as equation (1): • K • (1) xt = Σ α(k)xt-k + et • k=1 • Here α(k) is an autoregressive matrix of dimension (mxm) at lag k which connects xt and xt-k. K is the maximum lag in the VAR. et is a vector residual term of dimension (mx1). The integer K is large enough such that et is white noise. • Through (cointegrated) Vector Autoregression form (VAR)
Data • Data source: Yahoo finance • Daily adjusted closing stock prices for five firms: AFC Enterprises (AFCE), Cal-Maine Foods (CALM), Industrias Bachoco (IBA), Sanderson Farms (SAFM), and Tyson Foods (TSN) • Study period: Jun.1, 2001 to Jan.1, 2005
AFCE CALM IBA SAFM TSN Business Type Restaurant of chicken foods Egg producer, processor and packer Chicken and egg producer, processor and packer Chicken producer, processor and packer Chicken, pork and beef producer, processor and packer Stock market NASDAQ NASDAQ NYSE NASDAQ NYSE Market Cap. 250.15 M 668.44 M 1.44 B 759.37 M 6.03 B Employees 1,820 1,536 22,983(07) 9,705 104,000 EBITDA 49.20 M 222.49 M 194.65 M 175.52 M 1.07 B Net Income 23.10 M 133.59 M 120. 90 M 87.90 M 245.00 M Operation location USA, Columbia, Puerto Rico, Guam, and internationally USA Mexico USA (SE, WE, W) USA, export Headquarter location Georgia, USA Mississippi, USA Celaya, Mexico Mississippi, USA Arkansas, U.S.A. Summary on Firms
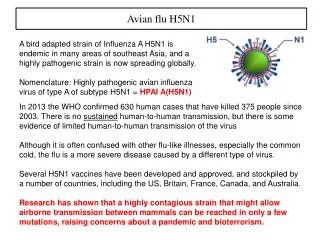
Timeline Country Virus Type January 8, 2004 Vietnam H5N1 January 11, 2004 Japan H5N1 January 20, 2004 Taipei China H5N1 January 23, 2004 Thailand H5N1 January 26, 2004 Cambodia, and Hong Kong H5N1 January 27, 2004 Laos H5N1 February 2, 2004 Indonesia H5N1 February 4, 2004 China H5N1 February 11, 2004 Delaware, USA H5N2 February 19, 2004 Canada H7N2 February 23, 2004 Texas, USA H7N2 March 15, 2004 Canada Timeline of AI outbreaks early 2004
Historical decompositions for Cal-Maine Foods from 8 January 2004 to 10 February 2004 Here we see information arising in CALM after January 15 is “pushing” the CALM price up; whereas information arising in AFCE after January 12 is pulling CALM price down.
Historical decompositions of Industrias Bachoco from 8 January 2004 to 10 February 2004 Here we see information in IBA after January 15 is pulling the price down; while information arising in AFCE after January 15 is pushing the price up.
Historical decompositions of Sanderson Farms from 8 January 2004 to 10 February 2004 Information arising in Sanderson farms after early February is pulling Sanderson Farms price down; whereas information arising in TSN after January 28 is puling Sanderson farms stock price up.
Historical decompositions of Tyson Foods from 8 January 2004 to 10 February 2004 Here the up-ward movement in TSN after January 23 is due to information arising in its own price (own errors are positive) and information arising in AFCE.
Historical decompositions of AFC Enterprises from 8 January 2004 to 10 February 2004 Here the upward movement in AFCE after January 13 appears to all be due to information arising in its own information shocks – no contribution from information arising first in other companies’ stock prices.
Historical decompositions of Cal-Maine Foods from 11 February 2004 to 15 March 2004 CALM appears to be exogenous over post February 11 data.
Historical decompositions of Industrias Bachoco from 11 February 2004 to 15 March 2004 IBA appears to be exogenous over post February 11 data.
Historical decompositions of Sanderson Farms from 11 February 2004 to 15 March 2004 The downward movement in SAFM equity price after February 11 is generated by information first noted in its own equity prices (its own errors) and those of TSN. SAFM shocks later on appear to move SAFM prices upward (say after February 13). TSN information continues to have a negative affect on SAFM well into late February.
Historical decompositions of Tyson Foods from 11 February 2004 to 15 March 2004 The negative movement in TSN after February 11 appears to be self generated.
Historical decompositions of AFC Enterprises from 11 February 2004 to 15 March 2004 AFCE appears to be exogenous over post February 11 data.
Conclusions • the AI outbreaks in Asia raised the stock prices of Cal-Maine Foods, Sanderson Farms, Tyson Foods and AFC Enterprises; • the AI infections in the United States dropped the stock prices of Industrias Bachoco, Sanderson Farms and Tyson Foods and raised stock prices of Cal-Maine Foods and AFC Enterprises. • Most of empirical findings are consistent with the theoretical results. AI outbreaks appear cause volatility of firm values through its effects on international trade.