Download
1 / 60
610 likes | 755 Views
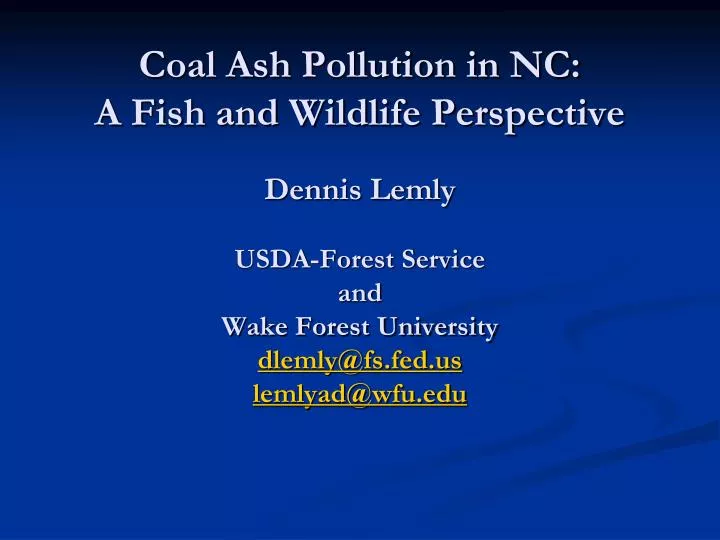
Coal Ash Pollution in NC: A Fish and Wildlife Perspective Dennis Lemly USDA-Forest Service and Wake Forest University dlemly@fs.fed.us lemlyad@wfu.edu. Coal is an Important Energy Source, But The Truth is Much Different Than The “Clean Coal” Myth Voiced by Industry. Here’s the Myth……. 1990’s.

E N D
Coal Ash Pollution in NC: A Fish and Wildlife PerspectiveDennis LemlyUSDA-Forest ServiceandWake Forest Universitydlemly@fs.fed.uslemlyad@wfu.edu
Coal is an Important Energy Source, But The Truth is Much Different ThanThe “Clean Coal” Myth Voiced by Industry
1990’s 2000 2012
“Clean Coal” is an Intentionally Deceptive Term Introduced and Promoted by the Electric Utility Industry in Advertising Campaigns to Persuade the Public to Think Differently About Coal-Based Energy. It Stems from Air Quality Improvements in SO2, NOX and CO2 Emissions….It has Nothing to do With Mining and Combustion Waste (ASH). Yet, Industry Would Have you Believe That it Does, and Uses This Disguise to Improve its Public Image.
Overburden is Removed and Dumped intoAdjacent Valleys…..Buries Streams
Operational Valley Fill….There was a Stream Here Before Mining
Over 2500 miles of streams buried by valley fills since 1995. • Clean Water Act standards and regulations not enforced by states or EPA. • Irreparable damage to streams and their fauna. • Local fish extirpated due to habitat loss and toxic water. • Fish poisoned downstream due to transport and bioaccumulation of selenium, which causes deformities and reproductive failure.
Selenium Poisoning in Fish • Selenium is a paradox -- required in the diet in small amounts (1-3 ug/g or ppm) but slightly more (5-10 ppm) is toxic. • Bioaccumulation in aquatic food chain results in 1000-5000x higher levels in fish and their eggs than in water. • Parent female deposits Se from her diet into egg yolk…..larval fish absorb selenium from yolk when they hatch…....Excess Se causes teratogenic deformity of skeletal features and edema. • Deformed larvae often die prior to swim-up, but some may survive and exhibit a wide array of developmental abnormalities, which are a biomarker of Se poisoning. • End result of embryo-larval poisoning is reproductive failure. • Reproductive failure can eliminate fish populations without visible “fish kills”.
Symptoms of Selenium Poisoning Normal Trout Larva
Belews Creek Steam Station, NC…. A Large Coal-Fired Power Plant
And Comes Out Looking Like This….. There are 629 Active Coal Ash Ponds in the US….And Even More “Closed” Ponds That Continue to Leach and Seep Selenium
Causes Deformities and Reproductive Failure….A 1980 Photo From Belews Lake, NC 19 of 20 Species Eliminated
A 2013 Photo From Lake Sutton, NC.Same Electric Utility and Same Selenium Toxicity 33 Years Later 29% of Bluegill Deformed
Active Ash Disposal Sites Where Selenium and Other Contaminants Exceed Water Quality Standards……Very Few (<5%) Have Been Studied for Biological Effects
EPA Designates High Hazard Sites Because of Risks to Public Health and the Environment. It Has Identified 181 of These Nationwide
What Does The Environmental Damage Cost? 5 Key Value Components of Cost 1. Ecological Value 2. Recreational Value 3. Human Health and Consumptive Use 4. Property Value 5. Aesthetic Value
Environmental Damage Cost at Duke Energy Sites in North Carolina Belews Lake = $531,153,873 (1976-2006) Hyco Reservoir = $864,742,344 (1978-2005) Mayo Reservoir = $80,825,500 (2000-2007) Lake Sutton* = $217,466,700 (1987-present) Dan River** = $295,485,000 (6-month assessment) Total*** = $1,989,673,417 (2014 dollars) *Only partial monetization of damage was possible due to lack of small fish to evaluate. **Damage valuation is on-going and not complete. ***Only 5 of 14 sites have been investigated.
84 Acre Ash Containment Area and Adjacent Ash Ponds at Kingston, TN
300 Acres Inundated with up to 30 feet of Ash Following the Blowout in December 2008
A Poignant Example of Private Property Risks From Surface Disposal of Coal Ash