Download
1 / 21
210 likes | 396 Views
Economic Optimization of Innovation and Risk. AIAA Symposium | System Engineering Robert Shuler | May 17, 2013. Goals of Presentation. Introduce engineers to risk compensation Generally engineers are not expected to read economics & psychology journals

E N D
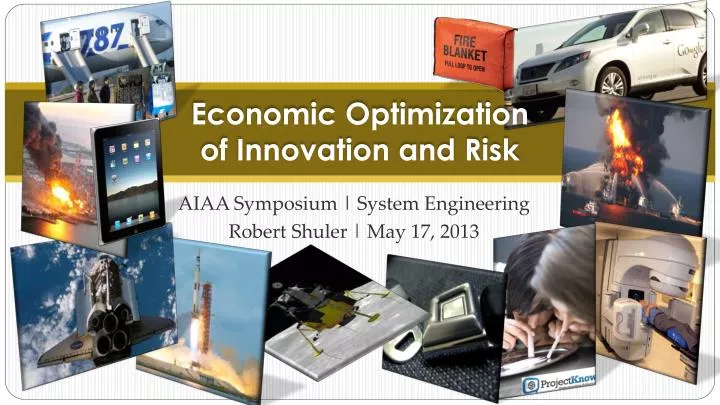
Economic Optimizationof Innovation and Risk AIAA Symposium | System Engineering Robert Shuler | May 17, 2013
Goals of Presentation • Introduce engineers to risk compensation • Generally engineers are not expected to read economics & psychology journals • Relation to other theories and existing practices • Striking and large examples of unexpected outcomes • Present a quantitative equation for optimization • More appealing and useful to engineers than vague psych/econ theories • Quantitative rationale for reliability decisions, including some post-Columbia actions • Summary of derivation, details are in paper – http://mc1soft.com/papers • Brief tutorial on applying the equation • Discuss a few of the examples in terms of equation parameters • Exercise: decision / alternatives on a hypothetical space projectcommercial passenger carrier for an orbital tourism / hotel facility
1969 quant safety goals not adopted bec of uncertainty in risk calculations • 1986 estimates of catastrophic failure so high would threaten political viability of programs Background Theories • Risk Analysis (Asipu 3200 BC, max release scenario for Nuc. Pwr. 1950s, probabilistic assessment post 1967 Apollo fire)http://www.rff.org/RFF/Documents/RFF-Resources-172_Risk_Assessment.pdfhttp://www.public.iastate.edu/~jdwolt/570X/2_RA%20History%20&%20Perspective.pdfhttp://www.econ-it2.eu/en/training/4-risk-management/4-1-the-essence-of-risk/4-1-1-the-origin-of-risk-analysis/ • Engineering / Statistical hypothesis – combination of estimated probabilitiesassumes a fixed mission profile (i.e. user behavior does not change – typically to an engineer, “human factors” means clarity and usability of controls, etc.) • Risk Management (de Mere, Pascal, Fermat, Bernoulli, de Moivre, Bayes from 17th century, Markowitz 1952)http://www.slideshare.net/ricardo.vargas/ricardo-vargas-historico-gerenciamento-riscos-ppt-enhttp://www.moaf.org/publications-collections/financial-history-magazine/93/_res/id=File1/Risk%20Management.pdf • Management hypothesis – identification, assessment & prioritization of riskstransfer, avoid, reduce or accept – assumes user behaves only as legally constrained • Includes insurance, futures & derivatives, e.g. pre-sale of farm crops • Risk Compensation (Peltzman 1975) • Economic hypothesis – humans & organizations optimize economic valuerisk may partly adjust when an improvement is made • Risk Homeostasis (Wilde 1982) • Psychological hypothesis – humans adjust behavior to maintain riskimprovement is wasteful pre-2008 ratings of Mortgage-Backed Securities & Credit Default Swaps NASA barred by law from using most common strategies – insurance, futures, derivatives Seatbelts do save lives, but not as many as expected e.g. More aggressive drivingwith anti-lock brakes – alsocondoms, bike helmets, skydiving gear…
Unexpected OutcomesTRAFFIC SAFETY • Montana No-Speed-Limit 1995-1999 • After 4 years, Montana recorded its historical low of number of accidents on affected roadwayshttp://www.hwysafety.com/hwy_montana.htm • Since then accident rates have begun to rise again • German Autobahn accident rates are lower than USA rates • No-Fault Auto Insurance • Leads to 6% increase in traffic fatalitiesCohen & Dehijia, J. of Law & Economics 2004 • Seat Belts vs. Air Bags
Unexpected OutcomesLARGE GOVERNMENT PROGRAMS • War on Drugs – “Just Say No” – DARE • Pioneered in 1970s by Richard Evans at University of Houston • Nancy Regan phrase 1982 • Testing by marketing experts shows: • “Just Say No” increased teen interest in drugs after exposure,promotes idea that other teens are using drugs – usage has increased! • DARE messages from police / authority not as effective as peer messages,e.g. publication of actual drinking statistics near dorms/frats on college campus reduced drinking • Costs: • Over $1 trillion & hundreds of thousands of lives • $33 billion for “Just Say No”, $20 billion to fight in home countries, Columbia violence moved to Mexico, now directly affects border regions and tourism, $121 billion to arrest and $450 billion to incarcerate non-violent offenders Behavioral, economic & possibly biologic factors
Unexpected OutcomesLARGE GOVERNMENT PROGRAMS #2 • War on Cancer • Begun by Nixon in 1971 • Inspired by successful Moon program • Promised cure by 1976 Some economic factors may be involved – but clearly a technically difficult problem
Unexpected OutcomesMISCELLANEOUS ACTIVITIES • Commercial Air Transportation • People will pay more for safety in the air – Carlsson 2002 • Consumers learn about unobservable safety from flight outcomes – Hartmann 2001 • Accidents adversely affect demand for other carriers • Airlines profits are greater if they are able to choose their optimal maintenance provision • Airlines AND consumers prefer an independent safety certification rather than an FAA minimummakes it more profitable to provide additional maintenance • Fire Safety Blankets • For a long time mainly used in USA, but USA has highest fire fighter death rate • USDA Forest Service concern about entrapment risk with improved 2003 fire shelter, developed with NASA help • July 2005 British Columbia bans use of fire shelters to prevent entrapment • Nuclear Energy 1.8 million lives already saved by nuclear energy!
Axioms & Approximations • Use linear approximations • Equation will certainly be valid about an operating point: • May or may not work well for large deltas • Cost of innovation axiom: (equilibrium condition) • Corporations will engage in innovation (adding Features, new models, etc.) until there is no incremental profit PF from doing so • Subsume all costs in PF except cost of the crash rate CR • PF – CR = 0 CR = PF • Similar in concept to marginal utility of safety (Spence 1975, Savage 1999) • Development Crash Rate approximation • Divide development cost Cdev by problem (bug) rate Rd to get cost per development bug Cd • To get total feature cost add manufacturing CF≈ CdRd + M • Rewrite: Rd≈ (CF – M)/Cd Agrees with our experience that hardware (M0)has fewer bugs in development than software (Cd0)
Axioms & ApproximationsCONTINUED. . . • Operational Crash Rate approximation • Use the concept of Defect ratio (defect leakage through testing process) • Not applicable to component wear/fatigue, but those processes are already well understood • Most modern failures are latent design or procedural issues: • All software failures, Fukushima reactor, Boeing 787 battery, Deepwater Horizon blowout, both Shuttle losses, etc. • Treat procedures like software, i.e. latent design issues (design of the procedure, or design of enforcement) • Even fatigue failures become latent design issues, i.e. they should have been caught by inspection / maintenance procedure • It follows that the operational failure rate is the development bug rate times D:RO≈ DRd(use consistent units – per hour, flight, device, etc.) • Substituting for Rd we have RO≈ (CF – M)D/Cd or CF≈ ROCd /D + M • Gives a relationship between operational failure rate RO and cost of features CF • Now we can apply our equilibrium condition – the cost of innovation axiom Note: our previous observations about development bug ratesnow apply to operational failures~more expensive development process lower the crash rate more valuable features more failures
The Crash Rate Model • First, a profit axiom • Economic utility (Value) to users of the given Feature set: VF • Seller/producer will set price = VF to maximize profit: PF = VF – CF • Combine previous axioms & solve for crash rate: • Apply the innovation axiom to get cost of crash crashes (failures): CR = VF – CF • Use operational crash rate axiom to replace CF : CR = VF – (ROCd /D + M) • Solve for crash rate: RO≈ (VF – M – CR )D/Cd • Express crash costs as cost per crash CC = CR/RO • High value, easily produced features encourage more use and more risk taking high RO High development costs lower crash rate Verification, inspection ,testing,analysis & quality controlmultiply the effect of Cdeven if they are cheap High cost per failure (e.g. air or nuclear) conservative & careful use, low RO
The Crash Rate Model EXPLAINS: How 6-sigma reliability helped Japanese automakers become largest in world (low “D”) - Now virtually all cars will go 200,000 miles - After 20 years of competitive evolution, Japan has lost this advantage How Boeing, ATT & IBM dominated with expensive but reliable products (high M & CC) Why you may not want to take a “fast-tracked” drug (Cd too low, D too high?) Why your PC and phone crash a lot and are subject to hacker attacks(high VF , low everything else) • First, a profit axiom • Economic utility (Value) to users of the given Feature set: VF • Seller/producer will set price = VF to maximize profit: PF = VF – CF • Combine previous axioms & solve for crash rate: • Apply the innovation axiom to get cost of crash crashes (failures): CR = VF – CF • Use operational crash rate axiom to replace CF : CR = VF – (ROCd /D + M) • Solve for crash rate: RO≈ (VF – M – CR )D/Cd • Express crash costs as cost per crash CC = CR/RO • High value, easily produced features encourage more use and more risk taking high RO High development costs lower crash rate Verification, inspection ,testing,analysis & quality controlmultiply the effect of Cdeven if they are cheap High cost per failure (e.g. air or nuclear) conservative & careful use, low RO
The Bad News • Competitive equilibrium • The formula assumes operation at the optimal profit point • If a company does not operate there, it will be acquired or bankrupted because others have more money • By culture, contracting, employee rotation & use of the same management consultants, Government generally operates close to the same point as industry • We have seen many administrations pledge to make “Government as efficient as industry” • Data may be unavailable for D during development, VF for gov’t programs (i.e. profit) • The Good News • It may be possible to shortcut 20+ years of trial and error and choose a “good” operating point – but we must learn how to react to new data ? 1979 Honda Civic 1979 Chevy Nova http://www.uniquecarsandparts.com.au/car_spotters_guide_japan_1979.htm http://www.detailshop.com/rides.php
Application to Examples • Montana speed limit? • Perception of greater risk (high RO) from • Bad crashes with speeding driver, high CC • Greater risk of crash due to other driver’s high D (errors) • Greater cognitive awareness of all risk factors vs. posted speeds which are considered by drivers to be conservative • No-fault auto insurance? • Reduced CC to driver, due to better insurance coverage and lack of fault penalties • Seat belt and air bag effects? • Perceived slightly lower cost CC (damage) from crashes when buckled • Relative to incorrectly perceived lower than actual risk/cost of unbuckled driving • Incorrect perception of near-immunity to CC with air bags, most crashes not head on, poor positioning of unbuckled occupants during crash • i.e. bags are of almost no value unless buckled up, and most of the protection comes from the belts
Application to Examples • War on drugs? • Add supply-focused enforcement to cost of M • VF made higher by erroneous “just say no” commercials • User CC made lower by medical advances and free emergency room ruling • War on cancer? • D ≈ 1 due to lack of a cure (all defects become operational defects) • Perceived VF rises as hope for cure persuades people to undertake expensive treatment • Air transportation? • CC is high and perceived higher (lottery effect, disaster avoidance effect) • D is very low due to independent certification & investigation • Dependence of VF on RO, value of high risk airline or airplane drops to zero
Application to ExamplesCONTINUED • Fire safety blankets? • Incorrect perception of low CC of entrapment • Nuclear energy? • Perceived extraordinarily high CC of failure • Low D for same reasons as air transport • Shuttle orbiter? • VF is not directly measureable for non-profit space projects – perhaps use total cost? • Cd and D are not known from easily accessible public records • Large testing costs applied to engines, avionics, tiles with many testing defects corrected high Cd/D • SRBs and foam were considered mature (low testing?) and many operational defects were ignored (high D) • Formula is meant to analyze a change (delta) • After 1986, military & commercial dropped – presumably VF lower, change in RO from 1/50 to 1/84 (nearly double) • In 1986 change from quasi-military crew to civilian (teacher) – no re-look at RO – compare to WWII bombing runs • Between planning and ops there was a 100 to 1 reduction in flight rate – how would this affect RO ? We will analyze this in the exercise – next!
Project Manager Exercise: • Commercial transport to orbital hotel / tourism facility • Goal is to sell tickets at VF = $1 million with recurring M < $750k per passenger • Using next generation SpaceX reusable launcher 20x < cost of current $133M for Dragon 7-passenger vehicle • 10 passenger reusable transport, dev cost $250M, 2 copies • 1 flight a week gives 10 x 50 x 250k = $250M/yr net revenue • Passengers sign waiver of liability but this is not expected to hold up in case of vehicle systems failure • At-fault accident liability estimated at $1B and no one will insure at reasonable price • Hotel & investors insist RO << 1 / 5 years to guarantee profits after liability • 1 / 25 years would be 1 / 1250 flights, still 1000x more risky than a 1000 mile auto trip (1 fatal crash / 100M miles) • Testing program • 10 test flights, revealing 5 major but not fatal problems, giving Cd = $50M • You are confident from risk analysis and test results that D < .1 (one more problem in another 10 flights) seems like a prettygood number but . . .
Crisis: • After RO publication & failure of a competing spacecraft: • Oops, that’s only 600 flights, with a crash expected every 12 years • Ticket sales top out at 100 due to perceived risk, the venture will fail • Hedge fund offers to rescue company, alter ticket price to $5M • 10 flights / year, revenue of $500M, mostly profit • Founder asks you… • What is risk of hedge fund plan? • How much money do you need to meet original goal of 25 year crash interval expectancy? Due to low flight rate and high financial pressure on each flight new plan expects crashes every 3.5 years Spend another $100M for 10 test flights(total 20) and if no problems, D < .05 … & reduce ticket price $50k S/W Air, one of the lowest ticket price carriers, is also one of the safest
Caveats: • Linear approximation range may be violated in this example • Still extremely useful for detecting direction of change and incremental amount of change • Static equilibrium equation only • Does not consider dynamics (speed), but humans respond remarkably fast, consider aviation inferences • All eggs in one basket equation, portfolio (Markowitz) approach unused by NASA since early 80s • Determination of D is not statistically valid • Infeasible to mount thousands of large missions • Use engineering analysis & inference methods along with independent verification [next slide] Due to low flight rate and high financial pressure on each flight new plan expects crashes every 3.5 years Spend another $100M for 10 test flights(total 20) and if no problems, D < .05 … & reduce ticket price $50k
A Methodology SuggestionHOW TO APPLY “SMARTS” EFFECTIVELY Re-Design Low Defects High Cd Production Defect Estimate High VolumeLow-Risk Return Development Defects Mature Reliable System Re-PlanEvent Ops Developer Testing Independent Testing Development Project Design DefectRatio Est. Re-development as iftest program continuing Opr. Inspection& Monitoring Function similar to Shuttle SE&Ioffice set up after Columbia
Conclusions: Re-Design • Provides insight into effects such as mission frequency and testing • Economic theory (supply curve, more is more difficult) is at odds with Engineering experience (learning curve) • Needed to provide rapid adaptation to new technology • 20 years is too long to “gain experience” with current & proposed rates of introduction of new technologies • Cheap vehicles need many test flights to lower D • Expensive verification is incompatible with the concept “cheap” – relying on CC restricts value of missions VF • Alternative (used in the exercise) is to get D very low, taking advantage of the low cost of missions for verification • Need a way to account for distribution of severity of defects (often logarithmic, e.g. earthquakes, foam loss?) Low Defects High Cd Production Defect Estimate High VolumeLow-Risk Return Development Defects Mature Reliable System Re-PlanEvent Ops Developer Testing Independent Testing Development Project Design DefectRatio Est. Opr. Inspection& Monitoring Re-development as iftest program continuing
Summary of Engineering Effects industrialengineering,automation &labor management creativedesign crash rate system engineering and project management safetyengineering test and verification processefficiency socialengineering