Download
1 / 37
370 likes | 477 Views
Section 8 Science Validation Process. Science Validation Team. Instrument Team Validate/re-establish and refine pre-launch characterizations Provide technology validation Participate on Science Validation Team NASA Selected Investigators

E N D
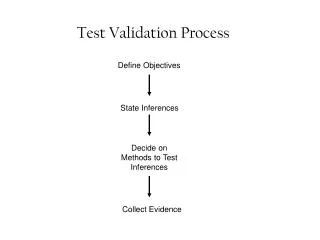
Section 8 Science Validation Process
Science Validation Team • Instrument Team • Validate/re-establish and refine pre-launch characterizations • Provide technology validation • Participate on Science Validation Team • NASA Selected Investigators • Conduct scene based instrument performance characterizations • Measure ability of instruments to make Landsat-like observations • Assess capability for addressing earth remote sensing applications • Assist in technology validation • Facilitate Commercial Applications (CRSP/SSC) • International Collaborators • Argentina, Australia, Canada, Italy, Japan, Singapore
If scientists supply accurate and reliable information, policy makers can make intelligent and responsible decisions to preserve an acceptable quality of life for our children and grandchildren.
Characterization & Validation • Characterization quantitatively describes how the three EO-1 instruments respond to incident radiation (light) under a variety of operating conditions. • Validation assesses the EO-1 instrument measurements by comparing them against ground “truth”. We also assess performance.
What’s So Exciting About Calibration? • Calibration is the stuff you do to insure accurate and repeatable measurements with the EO-1 instrumentsHo hum! • Calibration can be used to provide a common basis for inter-comparing global measurements across a variety of earth satellite observing systems with profound ramifications!
EO-1 and Landsat Landsat-7 EO-1 Less Than 1 Minute Landsat ETM+ Multispectral Swath Coverage (185 km @ 30 m) ALI Multispectral Swath Coverage (37 km @ 30 m) Atmospheric Corrector Hyperspectral Coverage (185 km @ 125 / 250 m) AVIRIS Underflight (10 km @ 20 m) Hyperion Hyperspectral Swath Coverage (7.5 km @ 30 m) 705 km Altitude
EO-1 ALI Landsat 7 ETM+ N EO-1 Atmospheric Corrector EO-1 Hyperion (7.5 KM) (37 KM) (185 KM) EO-1 and Landsat 7Descending Orbit Ground Tracks
EO-1 Instrument Overviews ALI 37 3 * Excludes thermal channel ** 35 cm-1 constant resolution
EO-1 Instrument Overviews 37 3 * Excludes thermal channel ** 35 cm-1 constant resolution Hyperspectral Analysis derives from the use of contiguous spectral channels, allowing the use of derivatives and sophisticated analysis techniques. The large number of bands allows more complex systems to be addressed without the under sampling inherent in multispectral systems.
SAC-C EO-1 Terra Landsat-7 12 min 1 min 27 min 10:03 10:15 10:02 10:42 The EOS AM Constellation Alignmentfor March, 2001
AM Constellation Descending Orbit Ground Tracks Terra MODIS SAC-C N Landsat 7 ETM+ EO-1 ALI EO-1 Hyperion EO-1 Atmospheric Corrector
EOC HS Task Sites Hyperion Sites Kakadu Cape Tribulation Lake Argyle Cooper Creek Daintree Batt Reef Mossman Townsville Reef Port Hedland Goldsworthy Panorama Kunoth Amburla Lake Eyre Moreton Bay Mt Fitton* Tinga tingana Toolabin *Uardry EOC Hyperspectral Sites Lake George *Kioloa Majura Valley Tanjil Bren * Potential 1st 60 days Sites X band sites
Zone 4 Jujuy Zone 2 Resistencia Zone 3 S. M. de Tucumán Zone 1 Posadas Zone 5 La Rioja Zone 7 Mendoza Zone 6 Córdoba Zone 0 Buenos Aires Zone 8 Neuquén Zone 11 Madryn Zone 9 Comodoro Rivadavia Zone 10 Gdor. Gregores Argentina Validation Site Zone Map for AVIRIS and EO-1/SAC-C overflights
Argentine Test Sites Cordoba Mendoza Madryn
“First Light” Image of Alaska L7 PAN ALI PAN
Why Is the ALI Pan Band Better Than the ETM+ Pan Band? • Improved Radiometric resolution • Superior signal-to-noise • 12-bit versus 8-bit representation of dynamic range • Inherently higher contrast measurement • ALI pan restricted to 480 – 490nm VIS spectral interval • ETM+ spans vegetation transition rise (520 – 900nm) • Smaller pixel size (IFOV) • ALI pan IFOV is 10 meters • ETM+ is nominally 15 meters (effectively 18 meters)
Hyperion Image - Argentina • Hyperspectral DCE Acquired Dec 1, 2000 • Color image produced using 3 bands in visible • Blue = band 14 (488 nm) • Green = band 20 (549 nm) • Red = band 38 (731 nm) (red shows areas of new spring growth) Image No. EO12000336_002002C_r1_image0su Approx. 7.5 km wide x 65 km long NORTH
Area of First Hyperion Image Collection (Green Square) Area of First Image