Download
1 / 18
240 likes | 439 Views
Introduction to Biological Oceanography. Biological Oceanography. 10-3. Global Patterns of Productivity. It is possible to estimate plant and fish productivity in the ocean. The size of the plankton biomass is a good indicator of the biomass of the remainder of the food web.

E N D
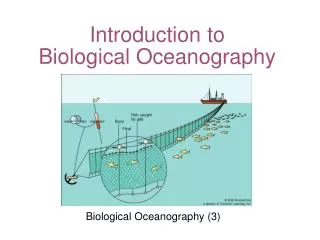
Introduction to Biological Oceanography Biological Oceanography
10-3 Global Patterns of Productivity It is possible to estimate plant and fish productivity in the ocean. • The size of the plankton biomass is a good indicator of the biomass of the remainder of the food web. • Annual primary production (APP) is equal to primary production rate (PPR) times the area for which the rate is applicable. • APP = PPR x Area (to which applicable ) • Transfer efficiency (TE) is a measure of the amount of carbon that is passed between trophic levels and is used for growth. • Transfer efficiency varies from 10 to 20% in most food chains.
10-3 Global Patterns of Productivity • Potential production (PP) at any trophic level is equal to the annual primary production (APP) times the transfer efficiency (TE) for each step in the food chain to the trophic level of the organism under consideration. • PP = APP x TE (for each step) • Although rate of productivity is very low for the open ocean compared to areas of upwelling, the open ocean has the greatest biomass productivity because of its enormous size. • In the open ocean the food chains are longer and energy transfer is low, so fish populations are small. • Most fish production is equally divided between area of upwelling and coastal waters. • Calculations suggest that the annual fish production is about 240 million tons/yr. • Over-fishing is removing fish from the ocean faster than they are replaced by reproduction and this can eventually lead to the collapse of the fish population.
10-4 Biological Productivity of Upwelling Water Upwelling of deep, nutrient-rich water supports large populations of phytoplankton and fish. • The waters off the coast of Peru normally is an area of upwelling, supporting one of the world’s largest fisheries. • Every three to seven years warm surface waters in the Pacific displace the cold, nutrient-rich water on Peru’s shelf in a phenomenon called El Nino. • El Nino results in a major change in fauna on the shelf and a great reduction in fishes. • This can lead to mass starvation of organisms dependent upon the fish as their major food source.
13-1 Biology of the Continental Shelf The waters of the neritic zone are fertile and support a rich community of organisms. • The plankton are floaters and weak swimmers which are helplessly transported by ocean currents. • Nekton have the ability to swim against currents and actively search for a more hospitable environment. • Many fish display schooling, another form of patchiness.
13-2 Biology of the Open Ocean and the Deep Sea The open ocean is the largest habitat on Earth, but life is sparse because of low nutrient concentration and great depth. • In the open ocean, diversity is high but the number of individual per species is low. • The only seaweed in the open ocean sea is Sargassum gulfweed. • The major phytoplankton are diatoms, dinoflagellates and coccolithophores and the major zooplankton are foraminifera and radiolaria. • Diatoms dominate the shallow coasts, but decrease in abundance seaward. • Top predators are mackerel, squid, jellyfish, tuna, porpoise, shark and man.
13-2 Biology of the Open Ocean and the Deep Sea The biomass on the sea floor tends to decrease with depth faster than it does with distance from shore. • The benthic food chains largely depend upon food from the surface which reaches the bottom. • Characteristics of the benthic organisms include: year-round reproduction, smaller broods, slow growth, and longer life. • Diversity of the benthos is greater than expected because the high predation rate prevents any group from dominating through competitive exclusion (when one group out-competes most others and drives them to extinction).
13-2 Biology of the Open Ocean and the Deep Sea • Four traits common to all abyssal depths are: perpetual darkness., low temperature, high hydrostatic pressure, and sparse food supply. • Rate of bacterial decay is greatly reduced under high hydrostatic pressure. • This means that organic material that settles onto the sea floor remains for a long time before it decays and is thus more likely to be consumed.