Download
1 / 17
170 likes | 318 Views
South Africa. Agricultural Situation 2011. Economic Highlights. Five year average real GDP growth of 3.7%, higher then the world average of 3.3% but lower than the Africa average of 5.0%. S.A. accounted for 0.5% of the World GDP and 31% of Sub-Saharan Africa GDP in 2009.

E N D
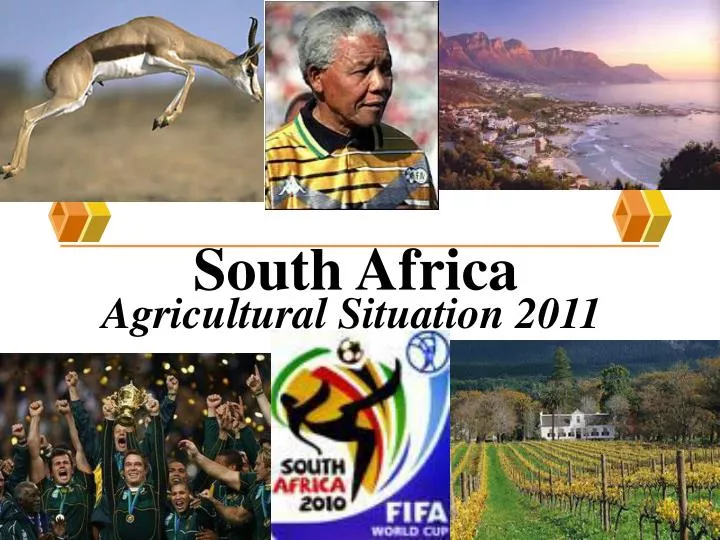
South Africa Agricultural Situation 2011
Economic Highlights Five year average real GDP growth of 3.7%, higher then the world average of 3.3% but lower than the Africa average of 5.0%. S.A. accounted for 0.5% of the World GDP and 31% of Sub-Saharan Africa GDP in 2009. Local household consumption expenditure on food, beverages, and tobacco is exceeding $40 billion per annum.
Agriculture & the Economy South Africa has a highly diversified agricultural sector which includes the production of all the major grains (except rice), oilseeds, deciduous and subtropical fruits, sugar, citrus, wine and most vegetables. Livestock production includes cattle, dairy, pigs, sheep, and a well developed broiler and egg industry. Has provided national food security since the start of the 20th century (Pop: ~4,0 million), right through to the 21st century (Pop: ~47 million, ~60% in cities) Primary commercial agriculture contributes about 3.0% to South Africa’s gross domestic product (GDP) Decline in commercial producers from 60,938 in 1996 to 39,982 in 2011
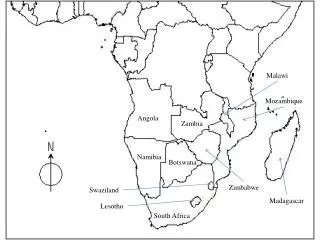
Land Use andCrop Zones in South Africa • 80% of the land is used for agriculture, but only 12% is arable, with the remainder being used for grazing, conservation, and wildlife.
Field crops 28% Animal products 47% Horticulture 25% Sector distribution of SA agricultural production
Agro-food trade • South Africa’s exports of agricultural products amounted to $5.2 billion in 2009. • Exports of agricultural products constituted 8.3 percent of South Africa’s total export basket in 2009. • Imports of agricultural products amounted to $4.2billion in 2009 a decrease of 10 percent over 2008. • Imports of agricultural products constituted 6.4 percent of South Africa’s total import basket in 2009.
Major agricultural products exported (US$ millions) 200820092010 Citrus $711.4 $667.1 $1,061.6 Wine $753.9 $727.5 $779.2 Apples $367.3 $364.7 $462.9 Table grapes $387.6 $379.7 $444.2 Corn $510.3 $444.6 $294.1 Sugar $217.9 $386.7 $254.5
Major agricultural products imported (US$ millions) 200820092010 Rice $463.9 $458.8 $388.0 Soybean cake $311.9 $297.1 $330.9 Wheat $444.6 $282.0 $295.2 Palm oil $299.3 $232.1 $274.4 Whisky $202.9$201.6$251.1 Soybean oil $288.5 $106.9 $247.6
US – SA Agricultural trade (US$ millions) 200820092010 SA ag exports to US $233.3 $226.4 $271.1 % of total exports to US 2.9% 4.5% 3.9% SA ag imports from US $327.6 $178.3 $277.6 % of total imports from US 4.6% 3.6% 4.9%
Major agricultural products exported to the US: (US$ millions) 2007200820092010 • Wine $38.7 $38.2 $37.2 $45.0 • Citrus $27.6 $33.4 $31.0 $50.0 • Sugar $7.9 $0.0 $19.3 $25.1 • Hides and skins $26.0 $18.4 $13.3 $0.78 • Fruit juice $9.5 $13.4 $11.3 $15.8
Major agricultural products imported from the US: US$ millions) 2007200820092010 • Wheat $116.2 $95.2 $10.2 $102 • Prepared food $28.0 $31.2 $28.1 $260 • Whisky $28.8 $23.0 $22.9 $18.9 • Fats and oils $13.3 $15.4 $5.6 $4.7
Current broader environment Negative impacts: Political uncertainty (new government), also internationally Crime, safety and security Macro-economic situation, esp. internationally Infrastructure constraints, esp. in rural areas Resource situation, e.g. water quality Policy issues, esp. Trade and Tariff Policy Educational system Competitiveness (Technology and innovation!) Land Reform HIV/Aids
Current broader environment Positive impacts: Democracy, albeit immature and developing Free press Market economy (part of global system) Strong fiscal position Greater cooperation between Govt and PS More external and internal investors New technology/expertise through multinationals Soccer World Cup 2010
Contact info Linston Terry Agricultural Attaché USDA - Foreign Agricultural Service Embassy of the United States of America Pretoria, South Africa Tel nr 27 12 431 4238 Fax 27 12 342 2264 E-mail: linston.terry@fas.usda.gov