Download
1 / 28
280 likes | 576 Views
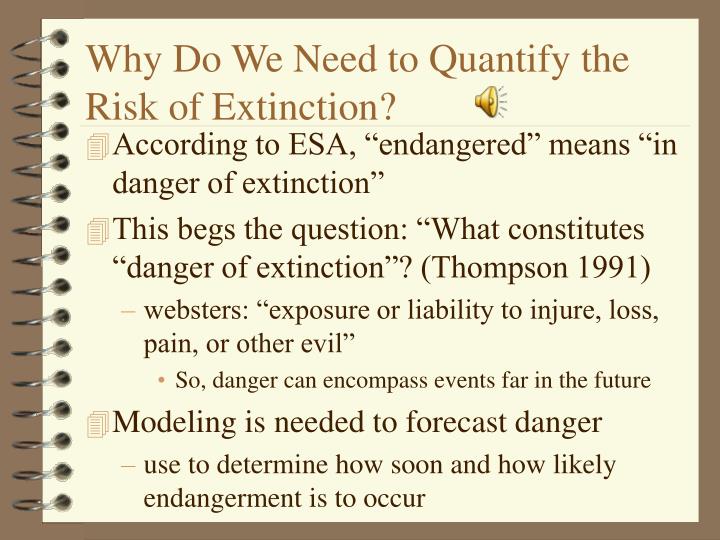
Why Do We Need to Quantify the Risk of Extinction?. According to ESA, “endangered” means “in danger of extinction” This begs the question: “What constitutes “danger of extinction”? (Thompson 1991) websters: “exposure or liability to injure, loss, pain, or other evil”

E N D
Why Do We Need to Quantify the Risk of Extinction? • According to ESA, “endangered” means “in danger of extinction” • This begs the question: “What constitutes “danger of extinction”? (Thompson 1991) • websters: “exposure or liability to injure, loss, pain, or other evil” • So, danger can encompass events far in the future • Modeling is needed to forecast danger • use to determine how soon and how likely endangerment is to occur
Estimation of Extinction Risk • Mathematical modeling to determine • minimum viable population sizes • relative importance of demographic, genetic, or environmental fluctuations to species’ survival • generically called Population Viability Analysis (PVA) • Four basic approaches • rules of thumb --deterministic models • simple stochastic models • detailed simulation models
Rules of Thumb (reviewed by Thompson 1991) • Aim is to provide a magic number above which populations are safe, below which they face unacceptable risk of extinction. • 50/500 rule (Franklin 1980) • Ne of 50 is short-term goal to prevent inbreeding depression • corresponds to 1% inbreeding per generation (half the maximum tolerated by domestic animal breeders) • Ne of 500 is long-term goal that will balance genetic variation created by mutation with that lost by genetic drift • from work on bristle number in fruit flies
50/500 Rule Still Used! • Problems • How to convert N to Ne? • 10% for fish, 25-33% for others???? • Most authors agree that to get a Ne of several hundred you need a census population of 1000 - 10,000 • This can be thought of as a “generic minimum viable population”
Approaches to PVA (Beissinger and Westphal 1998) • Deterministic Single Population Models • age or stage structure, age of first breeding, age or stage specific fecundity and survivorship • Stochastic Single Population Models • all of above + variance in fecundity and survival, carrying capacity, existence (or not) of density dependence, variance in carrying capacity, frequency and magnitude of catastrophes, covariance among demographic rates
PVA Approaches (Continued) • Metapopulation Models • Requirements from previous models + calculation of previous variables on a per population basis (if they differ), distance between populations, dispersal between populations (number, age, timing, density-dependence) mortality during dispersal
Most Complex PVA Model • Spatially-explicit Metapopulation • All of previous data needs + location of populations, movements among patches, changes in patches through time, habitat surrounding patches
Modeling Extinction is Easy with Deterministic Model • Time to extinction is easy to calculate • y=mx+b, where b=K, m=r and you solve for y = 1 (functional extinction) • time (y) = -lnK/r Deterministic Growth (exponential) K Slope = r Ln N Time
Models Incorporate Stochasticity • Recognize that growth rate of a population is not constant through time and that extinction is essentially a chance event (Dennis et al. 1991) • even populations in environments that, on average, are favorable for growth may go extinct due to stochastic perturbations (Shaffer 1981) • Types of stochasticity • demographic, environmental (large scale = catastrophe), genetic
Calculations Get Hairy Quickly When Stochasticity is Added! • Lande 1993 formula for time to extinction from carrying capacity with demographic stochasticity only • Math is beyond scope of this class, but we can examine • concepts, assumptions, and general findings
Defining Stochasticity (Lande et al. 2003) • Demographic Stochasticity • Chance events of individual survival and reproduction that are considered independent among individuals in a population • Environmental Stochasticity • Temporal fluctuation in survival and reproduction that occur simultaneously among all members of a population • Extreme form is also called a catastrophe
Demographic Stochasticity (Lande 1993) • Start population at K -time to extinction is a function of K (pop size) • = average per capita growth rate • depends on individual lx and mx • V = variance in individual fitness per unit time
Demographic correlates of Lambda—inverse connection to extinction • Juvenile survival important for spiders-as in most short-lived species (Schoener et al. 2003) • Adult survival important for birds (Sæther and Bakke 2000) Spiders Birds
Environmental Stochasticity • Start at K When c<1, then extinction is likely regardless of K As environmental variability increases, reduction in T(E) with N proceeds more slowly
General Results of Simple Models (Lande 1993, Leigh 1981, Lande et al. 2003) • Environmental stochasticity is more likely to cause extinction than demographic stochasticity • if sufficiently large populations (Ne ~100, but ranges from 10 – 1000, depending on species) • demographic effect is inversely dependent on N, but environmental effect is density independent • Extinction with environmental stochasisticity is unlikely when average per capita growth rate > variation in growth
More General Results • Population can persist a long time in presence of random catastrophes if average growth rate is positive • extinction is unlikely when growth rate between catastrophes > catastrophe size X catastrophe rate • Importance of catastrophes is not clearly different from importance of environmental stochasticity • demographic stochasticity is less than both when populations are large (> 100)
Exploring Actual Species • Sæther et al. 2005 • Looked at correlations between simulated time to extinction and population and stochastic parameters for 38 populations of birds in 18 species • Basically did PVAs of the birds and looked at what was associated with the various predicted survival times
As Extinction Removes Populations, Parameters Change (Sæther et al. 2005) • Time lag before changes in deterministic parameters (r and K) are seen • Populations with largest environmental stochasticity are the first to be lost • Demographic stochasticity does not correlate with loss until few populations are left • Deterministic aspects of population (growth rate and max pop size) also change and become more closely correlated with stochastic parameters as extinction proceeds • High growth rates and large population sizes characterize the last populations to go extinct
Remember those Island Spiders? • Schoener et al. 2003 • Life history, demographic stochasticity, environmental stochasticity, K were needed to accurately model 20 year history of population changes • Individual factors alone or in pairs were insufficient • PVA approach worked well—good test on actual data • Metepeira datona (small, large and stable populations, rare extinction) vs. Argiope argentata (large, moderate and variable population size, frequent extinctions) • Does fecundity, survivorship, development time (LIFE HISTORY) matter to extinction risk? • Survival still most important to population growth rate (see earlier table) • But longer immature period of Argiope makes it vulnerable to population fluctuations
Correlates of Extinction(Jones et al. 2003) • Compared aspects of secure, threatened, and extinct bats and other mammals worldwide • 25% of ~1000 species are extinct or threatened • Megachiroptera are most affected • 4% extinct • Small range is most important predictor of risk. Low aspect ratio of wing (~span / width) also was independently important (less efficient flight)
Equivocal Experimental Results • Daphnia populations exposed to variation in food(Drake and Lodge 2003)
Other Demographic Considerations • Allee effect: disruption of critical social behaviors when populations decline too far leads to rapid extinction for nongenetic reasons • Group foraging, defense, roosting • Reduced pollination, difficulty finding mates • Leads to deterministic decline of small populations to extinction • Difficult to tell apart from rapid decline to extinction in simulations of demographic stochasticity (Lande et al. 2003)
Of Relevance to Endangered Species • Population growth rates are likely to be negative • initial size does little to extend the average lifetime of a population • time to extinction scales with the natural logarithm of K divided by average r (Lande 1993) • Species with high fecundity and low annual survival are likely to require larger populations AND higher annual growth rates to remain extant than less fecund species with higher survival (Sæther et al. 2005) • Greater stochastic processes on these sorts of “weedy” species • Population size alone is not enough to rank a species’ vulnerability (Sæther et al. 2005) • Need to also know population trend (or expected trend based on population parameters) because of time lag in size-specific loss of populations
E(T) may be Misleading (Boyce 1992) • A few populations in simulations always take a very long time to go extinct • E(T) or the average time to extinction is therefore greater than the mode or median • E(T) thus overestimates survival likelihood Mode Median E(T) Frequency Positive skew Time to Extinction
Minimum Viable Population Concept (Shaffer 1981) • Population of sufficient size “to endure the calamities of various perturbations” • more than just surviving under average conditions • “the smallest isolated population having a 99% chance of remaining extant for 1000 years despite the foreseeable effects of demographic, environmental, and genetic stochasticity, and natural catastrophes”
Words to Live By • Soulé (1987) • “models are tools for thinkers, not crutches for the thoughtless.”
References • Dennis, B. Munholland, PL, and Scott, JM. 1991. Estimation of growth and extinction parameters for endangered species. Ecol. Monogr. 61:115-143. • Shaffer, ML. 1981. Minimum population sizes for species conservation. Bioscience 31:131-134. • Boyce, MS. 1992. Population viability analysis. Annual Review of Ecology and Systematics. 23:481-506. • Leigh, E. G. Jr. 1981. The average lifetime of a population in a varying environment. J. Theor. Biol. 90:213-239. • Lande, R. 1988. Genetics and demography in biological conservation. Science 241:1455-1460. • Simberloff, D. 1988. The contribution of population and community biology to conservation science. Ann. Rev. Ecol. Syst. 19:473-511
More References • Thompson, G.G. 1991. Determining minimum viable populations under the endangered species act. NOAA Technical Memorandum NMFS F/NWC-198. • Mann, C. C., and M. L. Plummer. 1999. A species’ fate, by the numbers. Science 284:36-37. • Soule, M. E. 1987. Where do we go from here? In M. E. Soule (editor), Viable populations for conservation. P. 175-183. Cambridge University Press, Cambridge. • Lande, R. Engen, S., and B-E Sæther. 2003. Stochastic population dynamics in ecology and conservation. Oxford University Press. • Sæther, B-E, et al. 2005. Time to extinction of bird populations. Ecology 86:693-700. • Jones, K.E., A. Purvis, and J.L. Gittleman. 2003. Biological correlates of extinction risk in bats. American Naturalist 161:601-614. • Drake, J.M. and D.M. Lodge. 2004. Effects of environmental variability on extinction and establishment. Ecology Letters 7:26-30. • Schoener, T.W., Clobert, J., Legendre, S., and D. A. Spiller. 2003. Life-history models of extinction: a test with island spiders. American Naturalist 162:558-573.