Download
1 / 31
310 likes | 405 Views
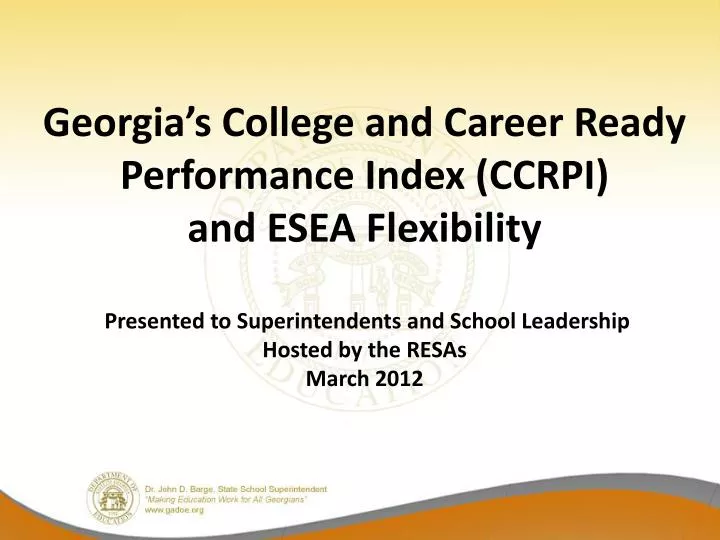
Georgia’s College and Career Ready Performance Index (CCRPI) and ESEA Flexibility Presented to Superintendents and School Leadership Hosted by the RESAs March 2012. Georgia’s Call to Action.

E N D
Georgia’s College and Career Ready Performance Index (CCRPI) and ESEA Flexibility Presented to Superintendents and School LeadershipHosted by the RESAsMarch 2012
Georgia’s Call to Action • GaDOE is committed to the creation of a comprehensive school improvement, accountability, and communication platform for our state’s schools and educational leaders that will enable all Georgia public school students to be college and career ready. • The successful implementation of the CCRPI is highly critical to “Making Education Work for All Georgians.”
Immediate Advantages of Georgia’s ESEA Flexibility Waiver Approval • Continue development and refinement of the College and Career Ready Performance Index (CCRPI) during 2012; • Identify Reward, Priority, and Focus Schools as prescribed by US ED; • Identify Alert Schools, which are unique to Georgia, and provide greater emphasis on subgroup performance and issues; • Use all state assessments in the identification of Priority, Focus, and Alert Schools; • Set Performance Targets to trigger Performance Flags (Performance Targets replace the Annual Measurable Objectives, AMOs, under AYP); • Exercise greater flexibility with federal funding; • Authorize districts to provide Flexible Learning Programs (FLPs) in lieu of Supplemental Education Services (SES) providers;
Immediate Advantages of Georgia’s ESEA Flexibility Waiver Approval • Follow state law (O.C.G.A. 20-2-2130 – 20-2-2131) relative to school choice; • Include Reward, Priority, Focus, and Alert status on the CCRPI public reporting structure; • Implement Teacher Keys Evaluation System (TKES) and Leader Keys Evaluation System (LKES) statewide; • Provide initial CCRPI report to systems by December 2012; • Submit refined CCRPI for US ED review in March 2013 (US ED deadline for submittal is May 24, 2013); and • Implement CCRPI (which includes the continuation of Reward, Priority, Focus, and Alert Schools designations) as Georgia’s Single Statewide Accountability System in 2013.
Reward, Priority, Focus, and Alert Schools School designations based on 2010-2011 assessment and graduation rate data
Reward SchoolsHighest Performing • Based on: CRCT – Reading, ELA, and Mathematics CRCT-M – Reading, ELA, and Mathematics GAA – ELA and Mathematics EOCTs – 9th Grade Literature and Composition, American Literature and Composition, Math I, Math II, Algebra, Geometry • 5% of Title I schools (78 Schools) • Highest performance for the “All Students” group (n size > 30) over 3 years • High schools with the highest graduation rates • May not be identified as a Priority School or a Focus School
Reward SchoolsHigh Progress • Based on: CRCT – Reading, ELA, and Mathematics CRCT-M – Reading, ELA, and Mathematics GAA – ELA and Mathematics EOCTs – 9th Grade Literature and Composition, American Literature and Composition, Math I, Math II, Algebra, Geometry • 10% of Title -1 schools (156 schools) • Highest progress in performance for the “All Students” group (n size > 30) over 3 years • High schools that are making the most progress in increasing graduation rates • May not be identified as a Priority School or a Focus School
Priority Schools • Three ways to be identified: • SIG Schools – 1003 (g) • Graduation Rate less than 60% over 2 years (proxy rate) • Achievement of “All Students” group (n size > 30) and a lack of progress on achievement over 3 years • Based on 2011 composite of : • CRCT: Reading, ELA, Mathematics, Science, and Social Studies • CRCT-M: Reading, ELA, and Mathematics • GAA: ELA, Mathematics, Science, and Social Studies • EOCT: 9th Grade Literature and Composition, American Literature and Composition, Algebra I, Geometry, Mathematics I, Mathematics II, Biology, Physical Science, U S History, and Economics • 5% of Title I schools – lowest achieving (78 schools)
Focus Schools • 2 ways to be identified: • Grad rate less than 60% over 2 years (proxy rate) and not identified as a Priority School • Largest within-school gaps between • Elementary and Middle Schools - CRCT highest achieving subgroup and the lowest achieving subgroup • High Schools - Largest gap between and highest subgroup and lowest subgroup in grad rate • Based on the n size > 30 • Based on 2011 composite of : • CRCT: Reading, ELA, Mathematics, Science and Social Studies • CRCT-M: Reading, ELA and Mathematics • GAA: ELA, Mathematics, Science and Social Studies • 10% of Title I schools (156 schools)
Alert Schools • 3 ways to be identified: • Graduation Alert • Subgroup Alert • Subject Alert • Based on minimum n size > TBD • Title I and Non-Title I schools • Graduation Alert: graduation rate is below 3 standard deviations from the mean of the state’s subgroups’ graduation rate (based on 9 ESEA subgroups) • Subgroup Alert: achievement rate is below 3 standard deviations from the mean of the state’s subgroups’ meets and exceeds rate (based on 9 ESEA subgroups) • Subject Alert: subject achievement is below 3 standard deviations from the mean of the state’s meets and exceeds rate for each subject • Based on 2011 composite of : • CRCT: Reading, ELA, Mathematics, Science and Social Studies • CRCT-M: Reading, ELA, and Mathematics • GAA: ELA, Mathematics, Science, and Social Studies • EOCT: 9th Grade Literature and Composition, American Literature and Composition, Mathematics I, Mathematics II, Biology, Physical Science, U S History, and Economics • Does not include Priority Schools and Focus Schools
Philosophical Shift • Identification of the lowest performing schools • Three year commitment of support • Complex issues
US ED Mandates Relative to Choice and Waiver • During 2011-2012 school year and beyond, a student who is already taking advantage of public school choice must be permitted to remain at his or her school until he or she has completed the highest grade in that school. The responsibility and cost of transportation of the student to and from the school will be assumed by the parent. • Beginning with school year 2012 – 2013, public school choice will be governed by Georgia Law O.C.G.A. 20-2-2130 – 20-2-2131. • By July 1 of each year, the local school system shall notify parents. which schools have available space and to which of these schools parents may choose to request a transfer. • The responsibility and cost of transportation of the student to and from the school will be assumed by the parent. • SES will be replaced with the Flexible Learning Program (FLP), which will be provided at the school level.
District Effectiveness • Identification of Priority Schools, Focus Schools, and Alert Schools • Development of Memorandum of Agreement • District Effectiveness Plan • District Review
Projected Timeline for Announcements (Priority, Focus, and Alert Schools) • Priority Schools – week of March 5th • Focus Schools – week of March 12th • Alert Schools – week of April 2nd • Dr. Reichrath will email notification of impending availability of school lists. • School lists will be available within the GaDOE portal.
Timeline • Spring • Identification of Priority Schools, Focus Schools, and Alert Schools • Assignment of school improvement specialist • Development of Memorandum of Agreement • Summer • School Improvement Grant Awards • Announcement of Reward Schools
TKES and LKES • Alignment of expectations • Students • Teachers • Leaders
Next Generation Accountability: CCRPI • The CCRPI has enormous potential as a model of innovation on the national reform stage. • February 2012 – Fall 2012, continue the development of CCRPI calculations utilizing stakeholder and TAC input. • By December 2012, publish CCRPI reports. • Implement CCRPI (which includes the continuation of Reward, Priority, Focus, and Alert Schools designations) as Georgia’s Single Statewide Accountability System in 2013.
DRAFT College and Career Ready Performance Index,High School Model Grades 9 - 12 Dr. John D. Barge, State School Superintendent “Making Education Work for All of Georgia’s Students” GRADUATION RATE Cohort Graduation Rate (%) POST HIGH SCHOOL READINESS Percent of graduates completing 3 or more Pathway Courses Percent of CTAE Pathway Completers earning a CTAE Industry-Recognized Credential Percent of graduated students entering Technical College System of Georgia technical colleges and/or University System of Georgia 2 or 4 year colleges and universities NOT requiring remediation or support courses Percent of graduates earning high school credit(s) for accelerated enrollment via Accel, Dual HOPE Grant, Move On When Ready, Early College, Gateway to College, Articulated Credit, Advanced Placement or International Baccalaureate courses Percent of graduates earning 2 or more high school credits in the same world language Percent of AP exams receiving scores of 3 or higher and/or percent of IB exams receiving scores of 4 or higher Percent of tested graduates scoring a minimum of 22 on the ACT (out of 36) or scoring a minimum of 1550 on the SAT (out of 2400) Percent of students scoring at meets or exceeds on the Georgia High School Writing Test Student Attendance Rate (%) CONTENT MASTERY (END of COURSE TESTS in some areas to be REPLACED by COMMON CORE ASSESSMENTS, 2014-15, ) Percent of students scoring at meets or exceeds on the Ninth Grade Literature End of Course Test Percent of students scoring at meets or exceeds on the American Literature End of Course Test Percent of students scoring at meets or exceeds on the Mathematics I (transitioning to CCGPS Coordinate Algebra) End of Course Test Percent of students scoring at meets or exceeds on the Mathematics II (transitioning to CCGPS Analytic Geometry) End of Course Test Percent of students scoring at meets or exceeds on the Physical Science End of Course Test Percent of students scoring at meets or exceeds on the Biology End of Course Test Percent of students scoring at meets or exceeds on the US History End of Course Test Percent of students scoring at meets or exceeds on the Economics End of Course Test Georgia Department of Education Dr. John D. Barge, State School SuperintendentMarch 15, 2012 • Page 1
DRAFT Factors for Successa companion to the College and Career Ready Performance Index for High Schools In addition to the eighteen (18) items within the College and Career Ready Performance Index, high schools may earn additional points for these supplemental indicators. • Percent of graduates completing three credits in the same world language • Percent of graduates taking the SAT or ACT • Percent of graduates earning credit in a physics course • Percent of students in grade nine earning 4 Carnegie Unit Credits in 4 core content areas • Percent of graduated students qualifying for the Zell Miller Scholarship as awarded through legislative guidelines managed by the Georgia Student Finance Commission 6. School has earned a Georgia Science, Technology, Engineering and Math (STEM) Program Certification • School or LEA-defined innovative practice accompanied by documented data supporting improved student achievement To Be Considered at a Later Date for inclusion on the mandatory indicators or the Factors for Success: Percent of tested students scoring at a proficient level on a Soft Skills Assessment Percent of tested students earning an AFQT score of 35 or higher on the Armed Services Vocational Aptitude Battery Percent of tested students scoring ‘College Ready’ on the COMPASS examination School’s average score on the Georgia Teacher Effectiveness Measurement School’s average score on the Georgia Leader Effectiveness Measurement Percent of students participating in the PLAN examination or the PSAT Percent of graduates completing Work Based Learning or a Senior Project Georgia Department of Education Dr. John D. Barge, State School Superintendent March 15 • Page 2
DRAFT College and Career Ready Performance Index,Middle School Model Grades 6 - 8 Dr. John D. Barge, State School Superintendent “Making Education Work for All of Georgia’s Students” CONTENT MASTERY AND PREPARATION FOR HIGH SCHOOL Percent of students scoring at meets or exceeds in ELA Percent of students scoring at meets or exceeds in reading Percent of students scoring at meets or exceeds in mathematics Percent of students scoring at meets or exceeds in science Percent of students scoring at meets or exceeds in social studies Percent of students scoring at meets or exceeds on the Grade Eight Writing Assessment Percent of students in grade eight achieving a Lexile measure greater than 1050 Student Attendance Rate (%) SUPPORTS AND INTERVENTION Percent of English Learners with positive movement from one Performance Band to a higher Performance Band Percent of Students With Disabilities served in general education environments greater than 80% of the school day Percent of students in grade eight passing at least four courses in core content areas CAREER EXPLORATION Percent of students in grade eight with a complete Individual Graduation Plan Percent of students completing 3 or more Career Interest Inventories from a preferred Career Interest System within GaCollege411, GCIS, or Career Cruising Georgia Department of Education Dr. John D. Barge, State School SuperintendentMarch 15, 2012 • Page 3
DRAFT Factors for Successa companion to the College and Career Ready Performance Index for Middle Schools In addition to the thirteen (13) items within the College and Career Ready Performance Index, middle schools may earn additional points for these supplemental indicators. • Percent of students in grade eight scoring proficient/advanced on the 21st Century Skills Technology Assessment • Percent of students in grades six and seven with a fully documented Fitnessgram assessment • Percent of students in grade eight scoring at exceeds in science • Percent of students successfully completing three years of courses in the fine arts and/or one world language and/or career exploratory • Percent of students in grade eight scoring at exceeds in mathematics • Percent of students in grade eight scoring at exceeds in social studies • Percent of eighth grade students earning at least one high school credit • Percent of eight grade students scoring at exceeds in reading • School has earned a Georgia Science, Technology, Engineering and Math (STEM) Program Certification • Percent of students in grades six through eight advancing to above grade level subject acceleration • School or LEA-defined innovative practice accompanied by documented data supporting improved student achievement To Be Considered at a Later Date for inclusion on the mandatory indicators or the Factors for Success: School’s average score on the Georgia Teacher Effectiveness Measurement School’s average score on the Georgia Leader Effectiveness Measurement Georgia Department of Education Dr. John D. Barge, State School Superintendent March 15, 2012 • Page 4
DRAFT College and Career Ready Performance Index,Elementary School Model Grades K - 5 Dr. John D. Barge, State School Superintendent “Making Education Work for All of Georgia’s Students” CONTENT MASTERY AND PREPARATION FOR MIDDLE SCHOOL Percent of students scoring at meets or exceeds in ELA Percent of students scoring at meets or exceeds in reading Percent of students scoring at meets or exceeds in mathematics Percent of students scoring at meets or exceeds in social studies Percent of students scoring at meets or exceeds in science Percent of students scoring at meets or exceeds on the Grade Five Writing Assessment Percent of students in grade three achieving a Lexile measure greater than 650 Percent of students in grade five achieving a Lexile measure greater than 850 Student Attendance Rate (%) SUPPORTS AND INTERVENTION Percent of English Learners with positive movement from one Performance Band to a higher Performance Band Percent of Students With Disabilities served in general education environments greater than 80% of the school day CAREER AWARENESS Percent of students completing ten Career Awareness Lessons by the end of grade five Percent of fifth grade students with a documented Career Portfolio Georgia Department of Education Dr. John D. Barge, State School SuperintendentMarch 15, 2012 • Page 5
DRAFT Factors for Successa companion to the College and Career Ready Performance Index for Elementary Schools In addition to the thirteen (13) items within the College and Career Ready Performance Index, elementary schools may earn additional points for these supplemental indicators. • Percent of students enrolled in world language courses • Percent of students enrolled in fine arts courses • Percent of students in grades one through five with documented data for the Fitnessgram assessment • Percent of students in grade five scoring at exceeds in science • Percent of students in grade three scoring at exceeds in mathematics • Percent of students in grade five scoring at exceeds in reading • Percent of students in grade five scoring at exceeds in social studies • School has earned a Georgia Science, Technology, Engineering and Math (STEM) Program Certification • Percent of students in grades one through five advancing to above grade level subject acceleration 10. School or LEA-defined innovative practice accompanied by documented data supporting improved student achievement To Be Considered at a Later Date for inclusion on the mandatory indicators or the Factors for Success: School’s average score on the Georgia Teacher Effectiveness Measurement School’s average score on the Georgia Leader Effectiveness Measurement Georgia Department of Education Dr. John D. Barge, State School Superintendent March 15, 2012 • Page 6
DRAFT Performance Flag Legend
Student Record Data Elements Crucial to CCRPI Calculations One data element touches multiple CCRPI calculations. Once the LEA Superintendent signs off on Student Record in June, GaDOE will not be able to make data corrections. The following student demographic elements should be reviewed for all students: • Student Grade Level • Race/Ethnicity • Economically Disadvantaged (ED) Status * • Student With Disability (SWD) Status ** • English Learner (EL) *** • Days Absent (Excused and Unexcused) • Days Present • Latest Withdrawal Date • Latest Withdrawal Reason Code * Students who are eligible for Free or Reduced Priced Meal. ** Students who are coded as receiving special education services at anytime during the school year. *** Students who are identified as EL or have exited the program and are being monitored for two years.
Next Steps for CCRPI • Refinement of the CCRPI • Communication of CCRPI progress • Incorporation of Priority, Focus, Alert, and Reward designations into CCRPI reporting structure for accountability purposes in 2013
Urgency of Timeline • Submit refined CCRPI for US ED review in March 2013 (US ED deadline for submittal is May 24, 2013). • If denied, ESEA flexibility for Georgia will expire at the end of the 2012-2013 school year and Georgia and its districts will be required to immediately resume complying with all ESEA requirements.
Georgia’s CCRPI and ESEA Flexibility Presentation Feedback • Be aware that you will be receiving an online survey opportunity regarding today’s presentation. • Feedback obtained from survey responses will inform the refinement of future presentations.
GaDOE Contact Information Martha R. Reichrath, Ph.D. Deputy State Superintendent (404) 656-2804 / mreichra@doe.k12.ga.us Avis King, Deputy Superintendent, School Improvement (404) 651-7277 / aking@doe.k12.ga.us Barbara Lunsford, Associate Superintendent, School Improvement (404) 463-4156 / blunsford@doe.k12.ga.us Joanne Leonard, Director of Accountability (404) 463-1538 / jleonard@doe.k12.ga.us Becky Chambers, Program Manager for College Readiness (404) 463-5098 / rchambers@doe.k12.ga.us Please direct questions, concerns, or input related to the CCRPI to your GaDOE Accountability Specialist identified at the following link: http://archives.doe.k12.ga.us/DMGetDocument.aspx/Accountability%20Specialists%20List%2012.15.11.pdf?p=6CC6799F8C1371F6A3166B63F6EDD61340572980934DF54CDECEA9B1B6C19E7F&Type=D