Download
1 / 19
190 likes | 249 Views
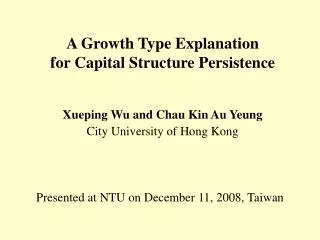
A Growth Type Explanation for Capital Structure Persistence. Key question. Offer a firm growth type story to explain the persistence in cross-sectional leverage. Why I like the paper. This paper offers a new perspective on a hot research topic: persistence in cross-sectional leverage.

E N D
Key question • Offer a firm growth type story to explain the persistence in cross-sectional leverage.
Why I like the paper • This paper offers a new perspective on a hot research topic: persistence in cross-sectional leverage. • My suggestions are minor ones.
Baker and Wurgler, 2002 (p.22) Persistence of past market timing effect,
Hovakimian (2001, 2004, 2006) • Equity issuers’ market-to-book ratios are significantly higher than debt issuers’ ratios long before, and long after, the transaction. • The negative effect of market-to-book on leverage and on the probability of debt vs. equity choice documented in numerous earlier studies is primarily a cross-sectional rather than a time-series phenomenon • The external finance weighted average market-to book ratio (Baker and Wurgler, 2002) contains information about growth opportunities not captured by current market-to-book ratio. • Higher historical weighted-average market-to-book ratios are associated with higher current capital expenditures and higher current R&D, which is consistent with the hypothesis that the importance of historical weighted-average market-to-book is due to its association with current growth opportunities
What is new in this paper: Firm growth type persistence • Low growth type (G1): a combination of a low market-to book ratio and high tangibility tends to characterize low-growth-type firms where asymmetric information tends to arise more from assets-in-place than from growth. • High growth type (G3): a combination of a high market-to-book ratio and low asset tangibility tends to reflect high-growth-type firms where asymmetric information is likely to arise more from growth than from assets-in-place. • Mixed growth type (G2)
a two-horse race between growth type view and the market timingview • Only Table 8 offers a comparison between growth type view and the market timingview
2 evidences for equity market timing • Capital structure is the cumulative outcome of attempts to time the equity market. • First, analyses of actual financing decisions show that firms tend to issue equity instead of debt when market value is high, relative to book value and past market values, and tend to repurchase equity when market value is low. • Second, analyses of earnings forecasts and realizations around equity issues suggest that firms tend to issue equity at times when investors are rather too enthusiastic about earnings prospects.
A two-horse race: Table 7 • ΔNet Equity= The change in net equity, or net equity issue • ΔDebt The change in Total Debt, or net debt issue • Could we have a Table 7 that use equity issuance, equity repurchase, debt issue, and Debt reduction as the dependent variable. • Current growth type view offers prediction on the equity issue, not equity repurchase
Table 7: 1. Are we testing leverage ratio changes or net equity issues (net debt issues)?2. Control for lagged leverage (Baker and Wurgler, 2002) lagged leverage, is included because leverage is bounded between zero and one. When leverage is near one of these boundaries, the change in lever- age can only go in one direction, regardless of the values of the other variables. Not controlling for lagged leverage may obscure the effects of the other variables.
Robustness Tests in Table 7: Alternative control variables including firm fundamentals in Table 6, given that we document persistent differences of firm fundamentals among three growth type firms.
Baker and Wurgler, 2002, external finance weighted average market-to book ratio • the summations are taken starting at the IPO year (or, in the All COMPUSTAT Firms sample, from the first year of COMPUSTAT data where stock price data are not missing), and e and d denote net equity and net debt issues, respectively,
A two-horse race: Table 8 • Similar to Hovakimian (2006) control for cumulative net equity issued and cumulative net debt issued
A two-horse race: Table 8 • To test the initial growth type story, control for initial investment behavior (Capex and R&D) and asset tangibility and see if the Initial MtBefwat-1 is still significant. • Whether it is initial growth opportunity or recent growth opportunity that more significantly affect leverage ratio?
Tables 7 and 8: • Are lnSize (Table 7) the same as lnSale in Table 8? • Is size measured as the log of net sales or Asset (according to Table 1)
A two-horse race: Table 6 • Does the firm fundamental changes around equity issues (in particular, profitability, asset growth, sales growth) for three growth type firms?
Table 6 • It seems more appropriate to scale the firm fundamental variables (cash, capex, R&D) by sales or market value of equity rather than book value of assets. • First, different growth types have different asset structures on the balance sheet (tangible or intangibles).
Generalized Myers-Majluf • The generalized Myers-Majluf model predicts that an increase in asymmetric information about growth helps facilitate new equity issues and can in some cases even produce a positive announcement effect of new equity issues. • Relevant in this paper?