Download
1 / 12
120 likes | 208 Views
Session 6: Other Analysis Issues. In this session, we consider various analysis issues that occur in practice: Incomplete Data: Subjects drop-out, do not complete study. Some missing data for completed subjects. Outcome=time for an event to occur, which does not occur in some subjects.

E N D
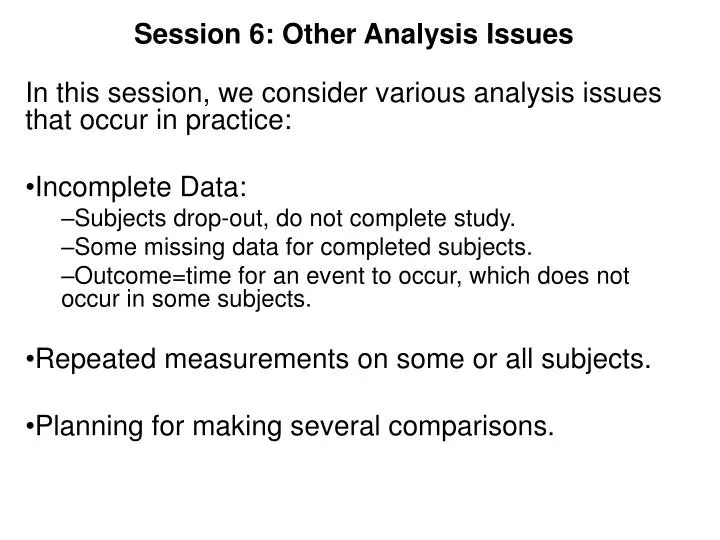
Session 6: Other Analysis Issues In this session, we consider various analysis issues that occur in practice: Incomplete Data: Subjects drop-out, do not complete study. Some missing data for completed subjects. Outcome=time for an event to occur, which does not occur in some subjects. Repeated measurements on some or all subjects. Planning for making several comparisons.
Hypertension Randomized Trial • Subjects randomized to one of 3 drugs for controlling hypertension: A: Carvedilol (new) B: Nifedipinr (standard) C: Atenolol (standard) • Diastolic blood pressure (dbp) is measured at each of 6 visits: Screen (week -1); Pre-trt (week 0); Post-trt weeks 2,4,6,8. • Consider primary outcome = Pre-Week8 dbp change. • Secondary outcomes include other changes and patterns throughout the 8 weeks. • Some subjects may miss some visits; others may "drop-out" completely.
Pattern of Available dbp Data in HTN Trial There was more drop-out under drug A: Number of Subjects Visit A B C ----------- ----- ----- ----- Pre-Trt 100 93 95 2 Week 100 93 94 4 Week 94 91 94 6 Week 87 88 93 8 Week 83 84 91 % w/o 8 Week: 17% 10% 4% p=0.01 • The primary analysis needs to account for differential drop-out. • Other analyses can examine reasons for drop-out. • Consider drop-out rate itself as an outcome.
Possible Analyses for Pre-Week8 dbp Change • Possible subject sets used in analyses: • All randomized: Intention-to-Treat (ITT). • Per-Protocol (meeting a compliance definition). • Evaluated at 8 weeks. • ITT outcome definitions for subjects with missing 8 week dbp: • Use latest dbp as week8 dbp ("last value carried forward") • Define change=0. • Use pre vs. week8 correlation among other subjects (mixed model); assumes missing pattern is not related to treatment.
Hypertension Trial Analyses Comparisons Analysis I: ITT with Last Value Carried Forward N=288 Overall p=0.0490 Estimated Difference p-value 95% CI A - B 10.90-11.39 = -0.49 0.7070 -3.08 to 2.09 A - C 10.90-13.93 = -3.03 0.0211 -5.61 to -0.46 B - C 11.39-13.93 = -2.54 0.0582 -5.16 to 0.09 Analysis II: Exclude Drop Outs N=258 Overall p=0.1438 Estimated Difference p-value 95% CI A - B 11.98-11.22 = 0.77 0.5630 -1.84 to 3.37 A - C 11.98-13.70 = -1.72 0.1860 -4.27 to 0.83 B - C 11.22-13.70 = -2.48 0.0558 -5.03 to 0.06 Analysis III: ITT with Drop Outs Assigned 0 N=288 Overall p=0.0209 Estimated Difference p-value 95% CI A - B 9.65 - 9.93 = -0.27 0.8296 -2.77 to 2.22 A - C 9.65 -12.86 = -3.21 0.0113 -5.69 to -0.73 B - C 9.93 -12.86 = -2.95 0.0230 -5.47 to -0.41
Secondary Analyses for HTN Trial • The patterns of dbp over 8 weeks - rates of change, e.g. - could be compared among drug groups. • Repeated measures analyses compare trends using only subjects with dpb at every visit. • Mixed models use all subjects with at least one visit. • What is the normal range prior to drug treatment? • Could use screen (week -1) or pre-trt (week 0) dbp. • Mixed models use both sets, recognizing pairing by subject.
Mixed Model Analyses • Generalize usual t-test, ANOVA, ANOCOV (which eliminate subjects with any missing data) when there is partial (missing) outcomes for some subjects. • Do not include subjects with missing independent variables (such as a covariate in ANOCOV). • Incorporate correlations among measurements replicated on subjects or among sets of subjects: • Find normal range for unteated dbp using both screen and week0 dbp, which are correlated in subjects. E.g., we want SD(among subjects), but SD of 2*100 = 2 dbp's in each of 100 subjects includes SD(among subjects) & SD(within subjects). Mixed models will separate these SDs even when subjects have varying # of measurements. • "Nested" subjects. The HTN study actually had 29 centers. Mixed models incorporate potential differences among centers, and enable generalization to all recipients of the drugs, not just in the chosen centers.
Multiple Analyses • Often, several comparisons are made with the same data. • If each test declares significance when p<0.05, the 1 of 20 comparisons are expected to be false positives. • Solution is to use smaller p-values for each test, or adjust p-values for the number and type of tests. • Two major issues: • All pairwise comparisons of several groups ("multiple comparisons"). • Comparison of groups several times sequentially throughout the study, as more subjects complete (interim analyses).
Multiple Comparisons • Specify prior to study (in protocol) comparisons to be made. In HTN study, only A vs. B and A vs. C, since B & C are current standard of care? • If all three pairwise comparisons (A-C, A-B, A-C) are to be made: Analysis I: ITT with Last Value Carried Forward Individual Comparisons Tukey-Adj'd Comparisons p-value 95% CI p-value 95% CI A - B 0.7070 -3.08 to 2.09 0.9250 -3.59 to 2.60 A - C 0.0211 -5.61 to -0.46 0.0548 -6.11 to 0.05 B - C 0.0582 -5.16 to 0.09 0.1399 -5.68 to 0.61
Interim Analyses • Often, comparison of groups will be made several times sequentially throughout the study, as more subjects complete the study. • These comparisons are usually made by an independent Data and Safety Monitoring Board (DSMB) and results are not revealed to the investigators or the public. • The purpose is usually to decide whether to end the trial early due to efficacy or inferiority of a test treatment (treatment A in the HTN study). • As with multiple comparisons, adjustment needs to be made for examining the same data repeatedly. • Interim analyses incorporate the fact that these multiple looks are made at the data. • Sometimes an interim analysis requires stronger evidence of efficacy than inferiority early in the study. Overall P<0.05 is maintained at study completion. An example (not for HTN study) illustrates this situation.
Example of Interim Analysis Stopping Guidelines Figure: Group sequential boundaries set at overall 0.05 level of significance. Crossing upper boundary = benefit; crossing lower boundary = harm. Z-value = standardized treatment - placebo difference in outcome.
Time-to-Event or Survival Analysis • Suppose that, in HTN study, outcome = time until dbp < K, for some K. • Each subject is observed for 8*7 = 56 days (or longer, in practice, due to continuous enrollment and a fixed termination date). • Possible data: Subject: 1 2 3 4 5 6 7 8 9 10 Days to dbp<K: 26 52 >56 40 >28 45 29 >56 >56 19 • Subjects 3,5,8,9 have "censored time". • If there are no censored time, mean or median time can be used. • Note that dropped subjects preclude just finding % with time < some time t. • Use survivial analysis methods with censored time: • Uses variable time for different subjects. • Can compare rates of events per time. • Can compare Prob[Time > t] among groups for any time t.