Download
1 / 15
150 likes | 163 Views
A presentation on Financial performance analysis on Agriculture Insurance Company of India(AIC).<br>The full Presentation describes about the financial performance During the rabi and kariff Seasons.

E N D
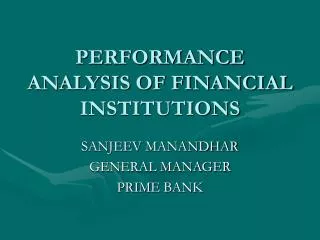
FINANCIAL PERFORMANCE ANALYSIS ON FINANCIAL PERFORMANCE ANALYSIS ON AGRICULTURE INSURANCE COMPANY OF INDIA LIMITED (AIC) Karteek Chedadeepu BIFAAS PGDM SSIM
AGRICULTURE INSURANCE: Claiming of risk from droughts,pests and diseases ➢ Agriculture insurance company came in 20th December 2002 different types of insurances ➢ Crop Insurance, Wheather Insurance, National Agriculture Insurance Scheme, Pradhana Manthri Fasal Bhima Yojana, Varsha Bheema Yojana. ➢ The first crop insurance scheme was “General Insurance” Department of Life Insurance Corporation of India ➢ Prof V.M. Dandekar is the father of crop insurance,introduced the pilot crop insurance in 1979 ➢
EVOLUTION OF AGRICULTURE INSURANCE SCHEMES Name of the policy underAgriculture Insurance Time period Comprehensive crop insurance 1985-1997 Experimental crop insurance 1997-98 National agriculture insurancescheme 1997-2000 Pilot scheme on seed cropinsurance 2000 Farm income insurancescheme 2003-04 Pradana manthri fasal bhimayojana 2016 febrauary
REVIEW OFLITERATURE ➢ The agriculture insurance study on the income guarantee scheme or the risk management tool,investment in infrastructure. -Jennifer iftt ➢ A study on interstate companies with respect to crop insurance ,the AIC taken the role of implementation agency from analysis it shows the AIC cannot bears all risk and gives poor interest, the private companies will bear all risk. -Sinha ➢ Farmers perception and awareness about crop insurance in north east part of India. - gowdappa, sb reddy, chandrashekar ➢ A study on farmers perception and awareness toward risk management tool. -Suresh kumara, Barahb,ranganathana
OBJECTIVE OFSTUDY The main objective of study is financial performance of the agriculture insurance company. to know the ➢ How many farmers were insured,from sum of amount. And it can know the analysis from the data. ➢
RESEARCH METHODOLOGY This study is based on the secondary data ➢ The data is collected from the the agriculture insurance company and IRDAI annual reports ➢
Data Analysis On Agri Insurance Company Particulars Gross Direct Premium GrowthRate Gross Direct Premium To Net Worth Ratio* Net Retention Ratio Net Commission Ratio Expenses Of Management To Gross Direct Premium Ratio Combined Ratio Underwriting Balance Ratio Net Earnings Ratio Solvency 2009-10 82.42 2010-11 2826 2011-2012 3214 2012-13 2796 2013-14 296 2014-15 -19.30 196.95 173.09 186.60 189.06 1.7 1.28 83.43 65.81 52.67 48.38 50.08 54.62 -3.49 -9,89 -17.43 -13.95% -10.13% -4.56 1.7 2.78 2.38 2.37 2.89 3.70 93.95 75.89 60.48 79.51 98.24 108.55 -11.24 32.11 36.8 14.7 0.02 -0.09 2.63 29.63 37 21.83 14.62 11.23 2.07 3.71 3.18 2.47 2.6 3.18
KEY ELEMENTS OFAIC 35 100 80 60 40 20 30 0 009-10 2 25 010-11 -5 2 20 011-2012 2 Net Commission Ratio Net R Ratio etention 15 -10 012-13 2 0 10 013-14 2 -15 5 014-15 2 0 -20 Gross Direct Premium GrowthRate -5 40 3 30 2.5 Underwriting BalanceRatio 2 20 Expenses of Management to Gross Direct Premium Ratio 1.5 10 1 0.5 0 0 -10 2010-2011 2009-10 2011-12 2012-13 2014-15 2013- 14… -20 40 35 30 25 20 15 10 4 3 Net Earnings Ratio 2 Available Solvency Margin Ratio to Required Solvency Margin Ratio* 1 5 0 0
INTERPRETATIONS ➢ The gross domestic premium have an increase in the 2011 and there is a change in 2015 ➢ The net retention period has slightly decreased year ➢ The net commission period has slightly decreased and increased in 2015 ➢ The combined ratio has gradually increased ➢ Net earnings ratio has been gradually increased and decreased slightly ➢ Under write of balance ratio starts with negative. And there is a slight I ➢ Increased and it came to negative points.
Present status Rabi crop insurance for 2011-15 Rabi 2011- 12 Rabi 2010-11 Rabi 2012-13 Rabi 2013-14 year No of farmers insured Sum insured No of farmers insured Sum insured No of farmers insured Sum insured No of farmers insured Sum insured - - 2011- 12 16.67 1,128 crore 4.17 lakh 1,128 crore 496787 8 110105 5.62 - - 2012- 13 5.97 1,531 cror 523929 9 112839 3.63 523929 9 112839 3.63 2013- 14 - - 20.37 crore 283458 crore 15702 11.636 136713 614167 7 157100 8.05 - - - - 2014- 15 - - 397358 8 125520 4.1
Karif Crop Insurance For 2010-15 Karif 2011 Karif 2012 Karif 2013 Karif 2014 Year No of farmer s insure d - Sum Insured No of farmers insured Sum Insured No of farmers insured Sum Insured No of farmers insured Sum Insured 2011-12 - 18.76 Crore 2,44,68 0 crore. 115545 61 234871 0.3 - - 20.37 Crore 2012-13 - - 283458 Crore 106454 05 271813 6 1064935 4 271990 6.0 2013-14 - - - - 103224 01 297960 1.5 9749600 290021 8.3 2014-15 - - - - - - 9683529 243878 3.9
Rabi 7000000 6000000 5000000 farmersinsured 4000000 sum 3000000 farmersinsured 2000000 sum 1000000 0 Rabi 2010-11 18.76crore 1,128 crore 4.17 lakh1,128 crore Rabi 2011-12 5.97 lakh1,531 cror - - Rabi 2012-13 - - 20.37crore 283458crore Rabi2013-14 14000000 Karif 12000000 10000000 8000000 farmersinsured 2013-2014sum 2014-15 farmers insured 6000000 4000000 sum 2000000 0 Kharif 2011 - -18.76 crore 2,44,680crore. Kharif 2012 - - 20.37 crore 283458crore Kharif 2013 - - - - Kharif 2014
ANALYSIS OF CURRENT STATUS ON RABI AND KARIF CROPS ➢ In 2010-11, Number of farmers were insured 16.67 for sum of 1,128 crores. ➢ In the Year 2011-12, These are the farmers were insured 4.17 lakh, for sum of the 1,128 crore
CONCLUSION ➢ It is very important to the farmers, to mitigate the losses ➢ We can know the financialperformance of the agriculture insurance company ➢ By this we can know the how many farmers are insured. ➢ And the growth of the company. ➢ It explains the less risk to farmers if they were insured.