Download
1 / 23
230 likes | 605 Views
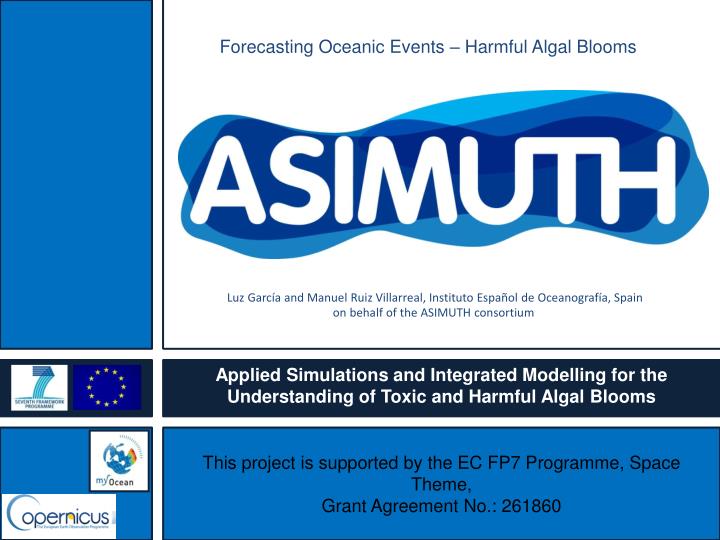
Forecasting Oceanic Events – Harmful Algal Blooms. Luz García and Manuel Ruiz Villarreal, Instituto Español de Oceanografía, Spain on behalf of the ASIMUTH consortium. Applied Simulations and Integrated Modelling for the Understanding of Toxic and Harmful Algal Blooms.

E N D
Forecasting Oceanic Events – Harmful Algal Blooms Luz García and Manuel Ruiz Villarreal, Instituto Español de Oceanografía, Spain on behalf of the ASIMUTH consortium Applied Simulations and Integrated Modelling for the Understanding of Toxic and Harmful Algal Blooms This project is supported by the EC FP7 Programme, Space Theme, Grant Agreement No.: 261860
ASIMUTH consortium Consortium of public institutes (R&D and monitoring agencies) and SMEs from UK, Ireland, Spain and Portugal coordinated by Dr Julie Maguire, Daithi O'Murchu Marine Research Station, Gearhies, Bantry, Co. Cork, IRELAND
What do we plan to deliver? A GMES-Copernicus downstream service to the European Aquaculture Industry The delivery of a 3-4 day Harmful Algal Bloom forecast for the aquaculture industry situated along Europe’s Atlantic margin
Why are we developing a HAB alert system? 2007: 1.3 million tonnes 20% of total fisheries products Valued at €3 billion per annum
Tools used in the HAB alert system Forecasting Lagrangian models Eulerian models IBM
ASIMUTH Model example: Portugal, Algarve September 2011 Simulations with lagrangian tracers (offline) Ostreopsis cf. siamensis bloom: 21-23 September 2011 (Lagos, Algarve)
Algarve 2011 – Model simulation Hindcast + Nowcast + Forecast (fed by the results from the operational model) Time to run model: two hours
Algarve 2011 – Closed beaches (impact) News on a National newspaper
Delivery system: developing a HAB DDSS (HAB-Distributed Decision Support system) In the HAB DDSS, modelling, satellite image analysis and in-situ data are delivered with the aim of producing short-term forecasts of harmful algal events along the European Atlantic coasts
Delivery system: IEO Viewer for data and model products Model data distributed in a Thredds (opendap, WMS, WCS...)OGC standards, aiming at complying with INSPIRE Directive
Forecast of ocean conditions on shellfish harvesting areas in Galicia
Hindcast: Model results of chlorophyll displayed on shellfishing areas in Galician Rias in spring 2006 Bloom more intense to the south
Bloom dominated by the possibly toxic (ASP) Pseudonitzschia spp.
Delivery system BARNAMAR smartphone App Developed by Starlab Barcelona and the owner is the Ajuntament de Barcelona.
Bulletin on the status of harmful and toxic algae: week 8 (19-25 February 2013) Ireland: Current conditions and Predictions Reported current conditions up to 11 February 2013 Biotoxin report (long-line mussels and oysters only) AZA toxins: AZA toxins are still present in shellfish along the west coast. Low levels found in Flat/Native Oyster, slightly higher levels in Pacific Oysters and highest levels found in blue mussels. ASP toxins: No data available. DSP toxins: Not present at inshore shellfish sites. PSP toxins: Not present at inshore shellfish sites. HABs report Pseudo-nitzschia levels are on the increase in Bantry Bay. Dinophysis: Low levels (40 cells/L) detected in the north. Alexandrium: Low levels (~400 ells/L ) detected in the north.. Pseudo-nitzschia:Low levels (~5,000 cells/L ) detected in southwest. Karenia mikimotoi: Low levels detected (240 ells/L ) detected in southwest Looking forward Toxins: AZA looks likely to depurate with increased feeding during Spring Bloom. This has started with diatom blooms most evident along the south coast. Potential blooms: ASP events usually occur in March – April. The ASP toxin (domoic acid) producing diatoms Pseudo-nitzschia are monitored. In the last 4 weeks the diatoms Pseudo-nitzschia have increased in the southwest. Pseudo-nitzschia blooms normal occur after the Spring bloom. Computer Model Physical forecasts: end forecast at 3 day current forecast SW coast, Bantry Bay Computer Modelled Particle Transport (phytoplankton tracking) 3 day forecast Print | Help | Ireland: Important Trends Azaspiracid AZA toxins have been persistent in shellfish along the SW, west and NW coasts since late 2012. The toxin levels remain constant. Domoic acid and Pseudo-nitzschia ASP toxins and Pseudo-nitzschia cell numbers are likely to increase in the next few weeks. HISTORIC TRENDS Shellfish Toxicity : ASP closures began in week 11 (March 2009), week 14 (April 2010), week 18 (May 2011) and week 15 (April 2012). Applied Simulations and Integrated Modelling for the Understanding of Toxic and Harmful Algal Blooms Past bulletins can be found at http://Asimuth.eu/HAB/bulletins.html
Bulletin on the status of harmful and toxic algae: week 8 (19-25 February 2013) Computer modelled 3 day Forecast Water flow into & out of Bantry Bay Shot Head cross section:Strong inward directed currents evident (64 % greater than average). Prediction: Waters toward the north shores will be stratified (colder less saline at the surface). Water transported into the bay is unlikely to have Dinophysis at this time of year. In the absence of Dinophysis, results indicate that Dinophysis will not be advected into Bantry over the next few days. Pseudo-nitzschia is present in the bay at the moment. Densities are likely to increase through in-situ growth . If present outside the mouth they will be transported into the bay. Mouth cross section: Predicted currents into the bay are 45 % Greater than average. At 30 m water will enter the bay with a flow > 60 m3/s. SW coast computer modelled 3 day forecast (Phytoplankton Transport) Forecast ends at 28-02-2013-0000hrs SW of Mizen Head: Particles released at 0 m, 20 m and bottom waters along the transect show the majority of particles headed in a northerly direction. Forecast for particles to enter SW bays in the next couple of days. Mouth of Bantry Bay: A computer model shows that particles released at 0 m, 20 m and bottom waters along the transect at the entrance to Bantry Bay show that most of the particles will be retained along the north coast. At the surface and 20 m, water will move into the bay. SW of Mizen Head Mouth of Bantry Bay 20 metres 20 metres
Bulletin on the status of harmful and toxic algae Week 8: 19-25 February, 2013 Chlorophyll a and Karenia mikimotoi cell densities (NMP and modelled) Computer modelled Karenia mikimotoi coming soon! Daily Sea Surface Temperature Temperature (°C) anomaly: Data taken from the Irish data buoy network where the anomaly is the weekly difference in SST compared to the long term mean (~ 10 yrs) Celtic Sea (M5) offline Southwest coast (M3) offline Northwest coast (M4) offline Observations: The Spring bloom has begun, chlorophyll levels range between 2 – 7 mg/m3 . Elevated levels are evident at the mouths of large rivers e.g. Galway Bay (river Corrib) and Clare (mouth of river Shannon) and off the off Donegal coast. Diatoms(Skeletonema spp. Lauderia / Detonula spp. )predominate samples with highest concentrations in the south and southwest. No Karenia mikimotoi bloom reported. IFREMER’s modelled SST product (MyOcean)
Potential benefits for aquaculture industry Allow protective measures to be implemented on time Change harvesting practices Make informed decisions with desired outcomes Determine what instruments should be developed to support management and policy decisions Assist the growth of the aquaculture industry through the design of improved management systems that are sustainable GEOSS Task SB-01 Oceans and Society: Blue Planet Strategic Targets (monitoring, analysis and prediction) Ecosystems: Increased operational monitoring of major marine and coastal ecosystems on an annual basis including properties such as extent, water temperature, salinity, pH and pCO2, phytoplankton species composition and productivity and marine resource stocks, based on remote sensing and sampled in-situ observations using internationally agreed standards. Agriculture: Improved collaboration and coordination on the use and applications of Earth observations for fisheries and aquaculture.
OGC (Thredds, Geoserver) Air, sea & ground based systems & instruments TAC = Thematic Assembly Centres MFC = Monitoring and Forecasting Centres Model products and in situ data (hydrography, HAB, biogeochemical data) gathered or generated by ASIMUTH with the possibility of distribution of some of them to GEO and data collaborators (Seadatanet, ICES, EuroGOOS, EMODNET, Copernicus)
ASIMUTH website: www.asimuth.eu The main pages, brochure and fact sheet have been translated into French, Spanish and Portuguese