Download
1 / 37
370 likes | 579 Views
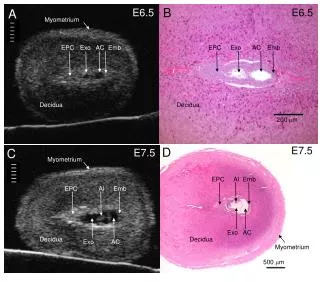
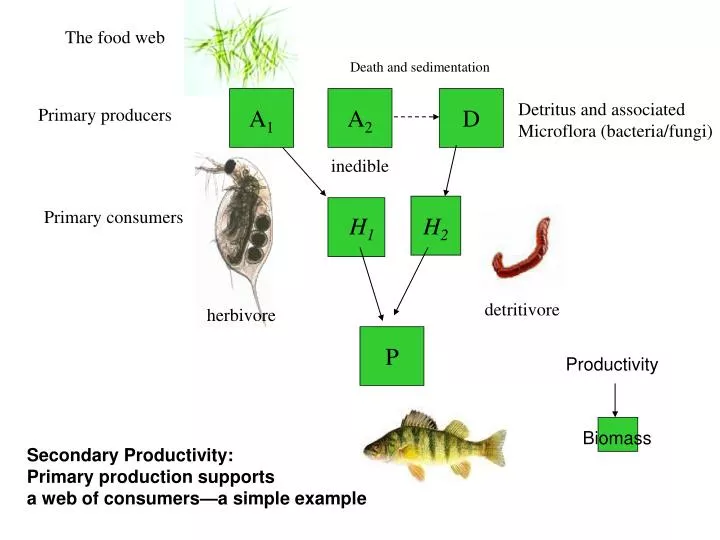
The food web. Death and sedimentation. A 1. A 2. D. Detritus and associated Microflora (bacteria/fungi). Primary producers. inedible. H 2. Primary consumers. H 1. detritivore. herbivore. P. Productivity . Biomass. Secondary Productivity: Primary production supports

E N D
The food web Death and sedimentation A1 A2 D Detritus and associated Microflora (bacteria/fungi) Primary producers inedible H2 Primary consumers H1 detritivore herbivore P Productivity Biomass Secondary Productivity: Primary production supports a web of consumers—a simple example
Defining some productivity terms bB/t Birth (production) term B Death (loss) term mB/t
The productivity is a combination of the birth of new organisms and the growth of the organisms already present Similarly, the death process is a combination of death of organisms and weight loss by existing organisms. If the productivity (birth term) exceeds the death term the biomass is increasing, and if the death term is larger, the biomass is decreasing Biomass of a consumer Time (t)
Rotifer Biomass Time (t) So if we measure and B at any point in time and we can estimate the specific birth rate, we can then obtain the specific death rate by subtraction.
A tiny organism like a rotifer is born at full size, so productivity amounts to measuring the rate at which new animals are born Rotifers carrying eggs • For a tiny consumer like a rotifer the birth rate is easy to estimate since the adult females carry their eggs around until they hatch • When they hatch they come out as full sized rotifers • . • If we know the fraction of adults carrying egs and the average time it takes for eggs to hatch, we can calculate the birth rate. • Since the rotifers are born more or less full size, so there is no need to model or measure the growth of individuals.
Rotifer Biomass Time (t)
Year classes For a large organism like a fish, biomass production occurs mostly from individual growth. New born fish are so tiny that birth of individuals makes a negligible contribution to biomass production The Wt represent the Weights of each year class • We can calculate the growth rate of biomass individual fish by weighing fish and determining their age and then seeing how much weight they gain each year. • The productivity of each age class is the Specific growth rate (SGR) of that age class times the total biomass of that age class in the population.
This approach assumes that the size vs age relationship is relatively constant. The Wtrepresent the Weights of each year class
By this method the average SGR for the whole population can be calculated as the weighted average over all age classes However there is a problem with this approach…???
However there is a problem with this approach. By considering only the gain in weight across age classes, this method ignores weight gained and lost within the same year, eg Gonad tissue Adult fish usually convert a considerable portion of their body mass to gonads and release it during spawning every year. Thus it does not add to next year’s weight and would not be recorded as growth We can quite easily correct for this by factoring in gonad production (add GSI) We would of course only make this GSI correction on adult age classes.
How can we tell how old a fish is? Scales of a chum salmon Measure distances from scale center to each annulus along a chosen axis 2+ 3+ 4+
LA Age yr This allows us to construct a growth curve based on length and age. Convert the growth curve based on length to weights using a length-weight plot for the species
Many types of bony structures are commonly used to determine age of fish Opercular bone Otolith Scale These three structures are all from the same 3+ year old 30 cm cutthroat trout
The specific death rates can also be estimated from the population structure. This time we assume that the age structure of the population is constant, and that the numbers of individuals of each age within a sample reflects the proportion of that age group in the population. Assume we have a sample of 215 pike from a population. The Nt / Ntrepresent the proportion of the population in each year class
150 The survivorship curve assuming stable age structure for the population looks like this 110 * 100 m1 =0.69 # 55 * 50 m2 =0.61 30 * 20 m3 =0.41 * 0 0 1 3 5 Age
Summary Productivity term loss term
Ecological efficiency (ln) for a consumer at the nth trophic level Ecological efficiency of zooplankton is usually around 10% of NPP in lakes Variability??
Fecal pellets Zooplankton such as Daphnia filter-feed using currents generated by their thoracic appendages. Fecal pellets sediment rapidly to the bottom
80-95% of energy is lost at each trophic step, much of it as feces Fecal pellets Assimilation efficiency Herbivores depends on diet ≈100% for sugary nectar ≈40-80% for small phytoplankton and filamentous algae <20% for mud and detritus Carnivores 60-70% for aquatic insects 70-90% for meat The undigested material in the zooplankton fecal pellets was not assimilated. Assimilation efficiency depends on the digestibility of the diet Cellulose, chitin, lignin or other undigestible material makes AE low Ingested energy ─ egested energy = assimilated energy Assimilation efficiency (AE, %)= assimilated energy/ingested energy x 100
Exploitation efficiency or Consumption Efficiency (EE) Exploitation efficiency is the consumption rate at a given trophic level divided by the productivity of the trophic level it feeds on. Zooplankton will have low EE (CE) when phytoplankton are sedimenting rapidly to the bottom before they are being eaten. If EE(CE) is high then most of the sedimentation will be in the form of fecal pellets, which sink more rapidly than individual cells. Zooplankton fecal pellets are good food for benthic invertebrates If EE for herbivorous zooplankton is low then dead (sedimenting) phytoplankton will be readily available for detritivores (zoobenthos)
Activity is energetically expensive and high Metabolic rate means low Production efficiency Gross PE Endotherms ≈5% or less ≈1% some birds Ectotherms ≈10-30% for fish ≈ 5-15% insects Otter swim about rapidly and spend large amounts of energy looking for fish to eat Assimilated energy ─ respiration ─ excretion = production (growth) Net Production efficiency (NPE, %)= growth/assimilation x 100 Gross PE (%)=[assim/ingest x growth/assim] x100=growth/ingest x 100
Pelagic fish like kokanee salmon expend a huge amount of energy actively searching for prey--they have high basal metabolic rates low conversion efficiencies The deepwater sculpin sits on the bottom and ambushes unsuspecting prey. They have very low basal metabolic rates and high conversion efficiencies If these two species were fed the same amount of food, the sculpin would grow more than twice as fast as the salmon
Copepod dominated communites have lower trophic efficiency than cladoceran dominated communities—possible reasons? Filter-feeding by a calanoid copepod • Copepods are rapid swmmers and generate feeding currents as they swim • Copepods filter-feed by generating currents with their 1st antennae and their thoracic appendages.. • Water from small eddy currents around the mouthparts is drawn over the fine setae of the maxillae, where small algae are collected and moved to the mouth. http://www.ucmp.berkeley.edu/arthropoda/crustacea/images/copepoda03.jpg
Energy budget for herbivorous zooplantkon NPP = rate of formation of phytoplankton biomass S = rate of production of uneaten algae, mostly inedible species (sedimentation) F= rate of production of fecal pellets (sedimentation) Metabolic costs include basal metabolism, activity costs and specific dynamic action (costs of digestion etc) Zooplankton production is the rate at which biomass (energy) becomes available for consumption by zooplanktivores
Energetic losses in the food chain Less than 1% of the incident light energy is captured by photosynthesis as NPP. Productivity declines by about 10-fold for each trophic level in the food chain. Most of the losses are are in the form of waste heat. Some energy from each trophic level winds up in the detrital pool, and some of this remains buried as sediment (or soil) organic matter (fossilized)
Benthic & epiphytic invertebrates Zooplankton Benthic & epiphytic algae plus detritus Phytoplankton Diet shift Trophic link Productivity at different levels in the food web 500 x (0.1)3g/m2/yr 500 x (0.1)2g/m2/yr 500 x 0.1 g/m2/yr NPP around 500 g/m2/yr Net productivity at level n = the rate of growth of biomass at that level = [SGR +GSI] * Biomass = NPP (TE) n-1
Yields of piscivorous fish are well correlated with primary productivity but are several orders of magnitude lower than PP
Intensive aquaculture can produce yields that are orders of magnitude beyond natural ecosystems How to maximize energy flow to fish Increased nutrient loading—fertilization + ammonia and anoxia tolerant species Shortening the food chain—primaryconsumers (eg carps, tilapia or mullets) Don’t rely on natural recruitment and managing the life cycle—stocking/hatcheries Increasing consumption efficiency—small pens intensive feeding Increased assimilation efficiency—feeding with easy to digest food pellets Increased production efficiency—low activity species that don’t mind crowding, , highly turbid water
Many aquaculture proponents argue that aquaculture reduces harvesting pressure on wild fisheries. Salmonid aquaculture not very trophically efficient, food pellets made from by-catch of wild species Major water quality issues—nutrientpollution from cages, anti-fouling paint, antibiotics, habitat destruction Transmit diseases to wild salmonids—bacteria, viruses, protozoans, fungi, “fish lice” –parasitic copepods and other Crustacea Genetic problems when domestic escapees compete with or interbreed with wild fish Lepeophtheirus salmonis Argulus
Summarizing concepts on Secondary production • The organic matter produced by primary producers (NPP) is used by • a web of consumers • NPP is used directly by primary consumers (herbivores and detritivores), which are in • turn consumed by carnivores. • Measurement of 2o Production is done by estimating the rate of growth of individuals • and multiplying by the number of individuals per unit area in the cohort (age or size group). • The efficiency of secondary production ranges from 5-20% (Avg 10%) • at each trophic level. • Efficiency depends on several factors--palatability, digestibility, energy requirements • for feeding (activity costs)(eg homeotherms vs poikilotherms , other limiting factors • eg water, and nutrient quality of food. • Trophic efficiency can be represented as the product of CE*AE*PE, each of which • is dependent on one or more of the above factors. • The yields of many important fisheries depends on a combination of NPP, the • length ofthe food chain leading to the fish being harvested, and the efficiency • of each step. • Many of the species that we harvest or very high in the food chain, so a great deal • of NPP is required to support them.
If the productivity of a phytoplankton population is 4000 k J (kilo Joules) /yr / m2, If sedimentation rate of dead cells to the substrate constitutes 1600 kJ/m2yr, and the phytoplankton population is dB/dt=0. If the rain of zooplankton fecal pellets to the bottom is 1400 kJ/m2/yr. What is the assimilation efficiency of the zooplankton trophic level (assume that they are all feeding on phytoplankton). 0.42 or 42% 0.60 or 60% 0.35 or 35% 0.25 or 25% None of these What is the exploitation efficiency EE (or Consumption efficiency CE) of the zooplankton trophic level 0.42 or 42% 0.60 or 60% 0.35 or 35% 0.25 or 25% None of these
If the net production efficiency of the zooplankton trophic level is 0.40 (40%) what is the ecological efficiency (l) of the trophic level 0.15 or 15% 0.05 or 5% 0.10 or 10% 0.25 or 25% None of these If the zooplanktivorous fish are consuming zooplankton at the rate of 400 kJ/yr/m2, their EE (CE) is 0.40 or 40% 0.60 or 60% 1.00 or 100% 0.25 or 25% None of these
If the zooplanktivorous fish have an assimilation efficiency of 0.70 (70%) and Net production efficiency (NPE) of 0.20 (20%), the productivity at this trophic level is 40 kJ/yr/m2 56 kJ/yr/m2 100 kJ/yr/m2 280 kJ/yr/m2 None of these If in another lake with similar zooplankton productivity the planktivore fish productivity was 2 X higher, a possible explanation for this would be the AE of the fish in that lake was 2X as high the NPE of the fish in that lake was 2X as high the EE (CE) in that lake was 2X as high the AE*NPE in that lake was 2X as high both b and d are true both b and c are true
Residence time and turnover of energy by trophic levels The standing stock of energy in the plankton is low but it is turned over rapidly, because the organisms are small, grow rapidly and don’t live long A Phytoplankton (0.01mg, life span, few days H2 H1 Planktonic Herbivore (50mg) life span 1 month Benthic Detritivore (0.1 g) life span 1yr P Carnivorous fish (100g) life span 5-10 yr Turnover is slower at higher trophic levels, since larger organisms accumulate energy over a longer life span—longer residence time and slower turnover