Download
1 / 32
320 likes | 509 Views
Technical Analysis. Philosophy of Technical Analysis :. Technical analysis is the process of analyzing a security’s historical price which effort to determine probably future prices (Steven B. Achelis)

E N D
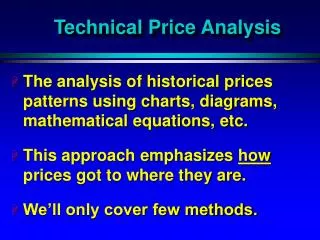
Philosophy of Technical Analysis : • Technical analysis is the process of analyzing a security’s historical price which effort to determine probably future prices (Steven B. Achelis) • Technical analyst is the study of market action, primarily through the use of charts, for the purpose of forecasting future price trends.
Assumptions of Technical Analysis • All information available on a security is reflected in its price • (Market price discounts everything : “ Semua kejadian yang dapat mengakibatkan gejolak pada bursa saham / harga saham seperti faktor ekonomi dan fundamental perusahaan termasuk kejadian yang tidak dapat diprediksikan sebelumnya spt : bencana alam dan perang akan tercermin dalam bursa saham serta harganya “ ) • Price move in discernible patterns and trends • ( Harga suatu saham akan tetap bergerak dalam suatu trend pada saat harga saham tersebut naik maupun turun ) • History repeats itself • ( Pergerakan historis dapat menjadi acuan untuk memprediksi pergerakan harga dimasa yang akan datang disebabkan oleh unsur psikologis pasar)
The art of technical analysis ( and it is an art. Not a science! ) lies in analyzing and/or manipulating historical price data to identify patterns and trends in price movements and using that information to forecast where price are headed from recent price activity. Even if you are a hard-core fundamental analyst, you can’t ignore technical analysis. Enough people believe in that the market moves on technical indicators.
Advantages Of Technical Analysis : • Its quick and easy • It does not involve data and accounting problems • It incorporates psychological as well as economic • reasons behind price changes • It tells when to buy ; not why investors are buying Disadvantages Of Technical Analysis : • Efficient market followers say it doesn’t work • If it worked it would self destruct. • It is too subjective to be of any real use
TREND LINE Trend line atau garis trend adalah suatu garis yang menandakan arah suatu pergerakan suatu harga saham. Garis trend mempunyai peranan yang sangat penting dengan penerapan teknik-teknik analisa teknikal yang ada seperti support & resistance, pola grafik, dll. Klasifikasi garis trend Bila dilihat dari segi lamanya suatu garis trend itu terbentuk, maka garis trend dapat dibagi menjadi tiga kelompok : • Major Trend (1 s.d 2 th) • Intermediate Trend (3 minggu s.d 6 bulan) • Minor Trend (2 s.d 3 minggu)
Jenis-Jenis Trend Up Trend line Untuk membuat garis trend naik, dengan menghubungkan minimal dua titik terendah Garis Up-Trend merupakan garis potensial support. Validitas up-trend semakin tinggi bila garis yang membuat garis trend tersebut semakin banyak. Tertembusnya garis trend menandakan terjadinya reversal trend (perubahan trend)
Down Trend line Untuk membuat garis trend turun, minimal menghubungkan dua titik tertinggi Garis down-trend merupakan garis resistance. Validitas down-trend semakin tinggi bila titik yang membuat garis trend tersebut semakin banyak. Tertembusnya garis trend menandakan terjadinya reversal trend (perubahan trend)
16500 16500 16000 16000 15500 15500 15000 15000 14500 14500 14000 14000 13500 13500 13000 13000 12500 12500 12000 12000 11500 11500 11000 11000 10500 10500 10000 10000 9500 9500 50000 50000 40000 40000 30000 30000 20000 20000 10000 10000 x100 x100 April May June July August September November 2001 February March April May HANJAYA MANDALA SAMPOERNA (13,500.00, 13,700.00, 13,450.00, 13,550.00), Parabolic SAR (12,199.63)
PT.INDOSATELLITE INDONESIA (8,500.00, 8,700.00, 8,450.00, 8,550.00) 11500 11000 10500 10000 9500 9000 8500 8000 7500 7000 6500 6000 15000 10000 5000 x1000 May June July August September November December 2001 February March April May Sideways Trend (Trend arah samping) Trend ini terjadi pada saat harga saham bergerak kearah samping dengan suatu trading range tertentu. Ciri-cirinya adalah harga saham umumnya akan naik.
Chart Pattern (Reversal Pattern) Double Bottom · Adalah Bullish Reversal, dimana terbentuk dua lembah pada level yang sama. · Konfirmasi terbentuknya “Double Bottom” jika garis tertinggi dari lembah kedua telah menembus garis neckline. Objective dari harga saham setelah terbentuk “double bottom” yakni sebesar Jarak antara Garis A dan B.
Double Bottoms Double Tops
Double Top · Adalah Bearish Reversal, dimana terbentuk dua puncak pada level yang sama. · Konfirmasi terbentuknya “Double Top” pada saat harga terendah dari puncak kedua menembus garis. Objective dari harga saham setelah terbentuk · “Double top” yakni sebesar jarak antara garis C dan D.
Flag Pattern pada Trend Turun Flag Pattern pada Trend Naik
Pennants Rising Wedges
Pola Pergerakan Triple Top, Double Top and Ascending Triangle
Pola Head and Shoulders Pola Inverse Head and Shoulders
Thank You PT. Erdikha Elit Gedung Sucaco Lt. 3, Jl. Kebon Sirih Kav. 71 Jakarta 10340 – Indonesia Phone : 021-39836420 (Hunting) Fax : 021-39836422