Download
1 / 1

E N D
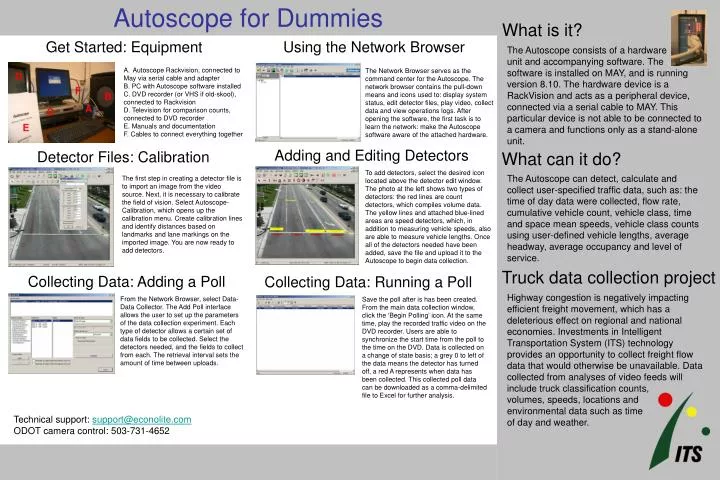
Using the Network Browser The Network Browser serves as the command center for the Autoscope. The network browser contains the pull-down means and icons used to: display system status, edit detector files, play video, collect data and view operations logs. After opening the software, the first task is to learn the network: make the Autoscope software aware of the attached hardware. Adding and Editing Detectors To add detectors, select the desired icon located above the detector edit window. The photo at the left shows two types of detectors: the red lines are count detectors, which compiles volume data. The yellow lines and attached blue-lined areas are speed detectors, which, in addition to measuring vehicle speeds, also are able to measure vehicle lengths. Once all of the detectors needed have been added, save the file and upload it to the Autoscope to begin data collection. What is it? Get Started: Equipment The Autoscope consists of a hardware unit and accompanying software. The software is installed on MAY, and is running version 8.10. The hardware device is a RackVision and acts as a peripheral device, connected via a serial cable to MAY. This particular device is not able to be connected to a camera and functions only as a stand-alone unit. • Autoscope Rackvision, connected to • May via serial cable and adapter • B. PC with Autoscope software installed • C. DVD recorder (or VHS if old-skool), • connected to Rackvision • D. Television for comparison counts, • connected to DVD recorder • E. Manuals and documentation • F. Cables to connect everything together Autoscope for Dummies Detector Files: Calibration What can it do? The Autoscope can detect, calculate and collect user-specified traffic data, such as: the time of day data were collected, flow rate, cumulative vehicle count, vehicle class, time and space mean speeds, vehicle class counts using user-defined vehicle lengths, average headway, average occupancy and level of service. The first step in creating a detector file is to import an image from the video source. Next, it is necessary to calibrate the field of vision. Select Autoscope-Calibration, which opens up the calibration menu. Create calibration lines and identify distances based on landmarks and lane markings on the imported image. You are now ready to add detectors. Truck data collection project Collecting Data: Adding a Poll Collecting Data: Running a Poll Highway congestion is negatively impacting efficient freight movement, which has a deleterious effect on regional and national economies. Investments in Intelligent Transportation System (ITS) technology provides an opportunity to collect freight flow data that would otherwise be unavailable. Data collected from analyses of video feeds will include truck classification counts, volumes, speeds, locations and environmental data such as time of day and weather. From the Network Browser, select Data-Data Collector. The Add Poll interface allows the user to set up the parameters of the data collection experiment. Each type of detector allows a certain set of data fields to be collected. Select the detectors needed, and the fields to collect from each. The retrieval interval sets the amount of time between uploads. Save the poll after is has been created. From the main data collection window, click the ‘Begin Polling’ icon. At the same time, play the recorded traffic video on the DVD recorder. Users are able to synchronize the start time from the poll to the time on the DVD. Data is collected on a change of state basis; a grey 0 to left of the data means the detector has turned off, a red A represents when data has been collected. This collected poll data can be downloaded as a comma-delimited file to Excel for further analysis. Technical support: support@econolite.com ODOT camera control: 503-731-4652 Portland State University