Download
1 / 18
180 likes | 226 Views
This study utilizes a simulation model to analyze the impact of varying host tree proportions, fractal dimensions, and dispersal models on landscape structure and pine population dynamics over 150 years. Questions addressed include outbreak patterns, landscape clumpiness, and the influence of structure on pine proportions.

E N D
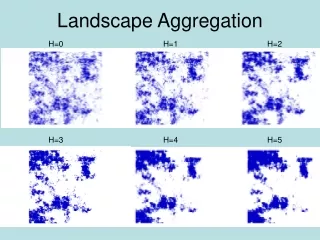
Landscape Aggregation H=0 H=1 H=2 H=3 H=4 H=5
Landscape Creation • RULE (Gardner) • 512 x 512 cells • Binary (host / non-host) landscapes • Variability in two parameters • Proportion of landscape as host • Fractal dimension
Populating the Landscapes • All trees placed on the landscape in year 0 are 10 years old • Host Trees • Table Mountain Pine: (Pinus pungens) • Pitch pine: (Pinus rigida) • Non-host species • 11 species • Randomly placed in non-host cells
Experimental Design • Factors • Proportion of landscape in pine • Levels: 25 % & 40 % • Fractal dimension of landscape • Levels: 0, 0.1, 0.2, 0.3, 0.4, 0.5 • Dispersal model • Levels: Distance limited, Ubiquitous • Replications • 50 Replicate landscapes
LANDIS runs • No fire • BDA active to simulate SPB outbreaks • 150 year runs
Analysis Questions • How does the proportion of pine on the landscape change over time? • How does the proportion of pine on the landscape over time vary with initial values of h & p? • Is the proportion of pine on the landscape over time related to the dispersal model? • How well does the clumpiness metric represent differences among the values of h? • When do outbreaks occur? • Why are there more level 3 outbreaks at high initial h values? • How does the area of particular classes vary with clumpiness? • How does clumpiness change over time at different initial h & p values? • How does the size and severity of outbreaks change over time? • How are the size and severity of outbreaks influenced by landscape structure • How does landscape structure change over time? • How does landscape structure affect the proportion of pines on the landscape over time?
How does the proportion of pine on the landscape change over time?
How does the proportion of pine on the landscape over time vary with the initial values of h & p?
How well does the clumpiness metric represent differences among the values of h?
Outbreak Area vs. Clumpiness Class 0 Class 1 Class 2 Class 3