Download
1 / 19
190 likes | 298 Views
Black Rat ( Rattus rattus ) Population Densities on Navy Support Facility Diego Garcia, British Indian Ocean Territory. Diego Garcia is part of the United Kingdom in the British Indian Ocean Territory (BIOT). Small atoll, ~39 miles from tip to tip. Predominately Coconut Forest.

E N D
Black Rat (Rattusrattus) Population Densities on Navy Support Facility Diego Garcia, British Indian Ocean Territory
Diego Garcia is part of the United Kingdom in the British Indian Ocean Territory (BIOT)
Rats can have devastating effects on island ecosystems • Prey on native birds: adults, chicks and eggs depending on the species • Prey on native invertebrates and smaller vertebrates • Impact native plants by seed consumption • Human health impacts
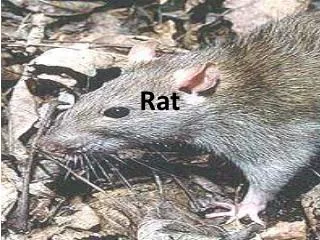
Rats on Diego Garcia are common. • Often observed during daytime. • Population densities had never been estimated and rat diet had never been assessed.
Coconut forest trapping grid: 144 traps (12 x 12), with 20 meter spacing between lines and traps. • Area covered = 220 meters x 220 meters, 4.84 hectares (11.95 acres) • Mixed forest trapping grid: 121 traps (11 x 11), with 10 meter spacing between lines and traps. • Area covered = 100 meters x 100 meters, 1 hectare (2.47 acres) • Rats captured on the mixed forest grid were necropsied for diet, health and reproductive condition.
Traps attached to trees, ~1 meter off of the ground to mitigate crab interference. Baited with coconut and peanut butter. Traps checked and re- baited (if needed) in the early morning and late afternoon.
A problem with grid trapping: animals come from off of the grid area to be trapped but don’t know how far off. Therefore, the area sampled by the trapping grid is larger than the grid dimensions. Need to know the area sampled to calculate a density (animals per unit of area) ↓ * * * * * * * * * * * * * * * * * * * * * trapping grid * * * * * * * * * * * * * * * * * * * * * * * * * * * *
So, assess daily movement of rats with thread bobbins. Glue on, release and follow the thread. Estimate home range or daily movements and add an appropriate size “buffer strip” to the grid dimensions to estimate the sampling area of the grid.
Results • A total of 914 rats were captured on the coconut forest grid over 11 days of trapping and125 rats were captured on the mixed forest grid over 8 days of trapping. • Abundance estimate for the coconut forest grid was 1139 rats (95% confidence interval: 1075-1229) and 142 rats (95% confidence interval: 132-167), for the mixed forest grid. Data analyzed on program MARK as a removal project. • Thread bobbin data (7 animals) showed very small home ranges with a mean of 705m² (27m x 27m). • Adjusted sampling area (grid size plus buffer strip was 6.1 hectares for coconut forest grid and 1.6 hectares for the mixed forest grid.
Density estimate in coconut forest is 187/ha (95% Confidence Interval: 176-201) and 88/ha (95% Confidence Interval: 82-104) in mixed forest. • 81% of rat stomachs contained coconut, along with other vegetation, animal tissue (possibly geckos) and 67% had coconut exclusively.
At both sites ~30% of the population was active during the day. Coconut Forest
Conclusions • The mixed forest grid was trapped out in less time due to a higher density (4x higher) of traps. • The densities are high enough that a segment of the population (30%) is now diurnal, an example of resource partitioning (night shift and day shift). • The high population densities are fueled by abundant coconut. • The sheer number of rats points to environmental impacts but don’t know what at this stage. • Rat eradications on islands are becoming more common and might be possible on Diego Garcia