Download
1 / 1
10 likes | 104 Views
Multi-Source Thunderstorm Rainfall Estimation using Infrared and Lightning Data. Ali S. Amirrezvani & Drs. Shayesteh Mahani and Reza Khanbilvardi Dr. Steve Goodman.

E N D
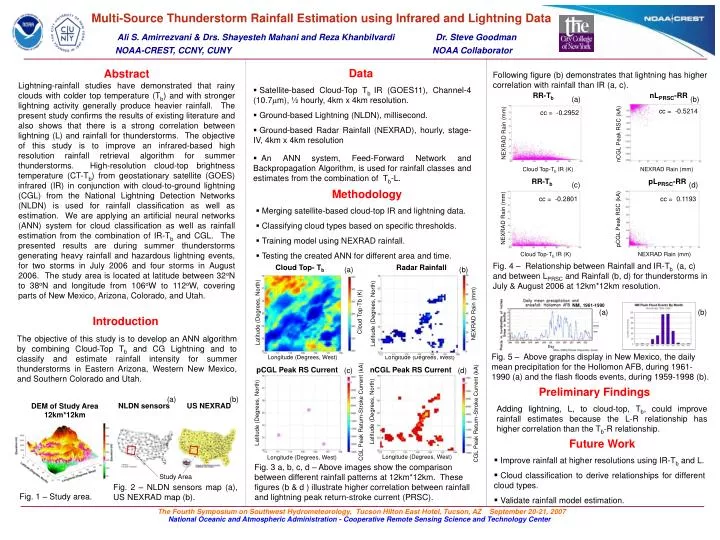
Multi-Source Thunderstorm Rainfall Estimation using Infrared and Lightning Data Ali S. Amirrezvani & Drs. Shayesteh Mahani and Reza Khanbilvardi Dr. Steve Goodman NOAA-CREST, CCNY, CUNY NOAA Collaborator Data • Satellite-based Cloud-Top Tb IR (GOES11), Channel-4 (10.7mm), ½ hourly, 4km x 4km resolution. • Ground-based Lightning (NLDN), millisecond. • Ground-based Radar Rainfall (NEXRAD), hourly, stage-IV, 4km x 4km resolution • An ANN system, Feed-Forward Network and Backpropagation Algorithm, is used for rainfall classes and estimates from the combination of Tb-L. Abstract Lightning-rainfall studies have demonstrated that rainy clouds with colder top temperature (Tb) and with stronger lightning activity generally produce heavier rainfall. The present study confirms the results of existing literature and also shows that there is a strong correlation between lightning (L) and rainfall for thunderstorms. The objective of this study is to improve an infrared-based high resolution rainfall retrieval algorithm for summer thunderstorms. High-resolution cloud-top brightness temperature (CT-Tb) from geostationary satellite (GOES) infrared (IR) in conjunction with cloud-to-ground lightning (CGL) from the National Lightning Detection Networks (NLDN) is used for rainfall classification as well as estimation. We are applying an artificial neural networks (ANN) system for cloud classification as well as rainfall estimation from the combination of IR-Tb and CGL. The presented results are during summer thunderstorms generating heavy rainfall and hazardous lightning events, for two storms in July 2006 and four storms in August 2006. The study area is located at latitude between 32oN to 38oN and longitude from 106oW to 112oW, covering parts of New Mexico, Arizona, Colorado, and Utah. Following figure (b) demonstrates that lightning has higher correlation with rainfall than IR (a, c). RR-Tb nLPRSC-RR (a) (b) cc = -0.5214 cc = -0.2952 NEXRAD Rain (mm) nCGL Peak RSC (kA) Cloud Top-Tb IR (K) NEXRAD Rain (mm) RR-Tb pLPRSC-RR (c) (d) Methodology • Merging satellite-based cloud-top IR and lightning data. • Classifying cloud types based on specific thresholds. • Training model using NEXRAD rainfall. • Testing the created ANN for different area and time. cc = -0.2801 cc = 0.1193 NEXRAD Rain (mm) pCGL Peak RSC (kA) Cloud Top-Tb IR (K) NEXRAD Rain (mm) Fig. 4 – Relationship between Rainfall and IR-Tb (a, c) and between LPRSC and Rainfall (b, d) for thunderstorms in July & August 2006 at 12km*12km resolution. Cloud Top- Tb Radar Rainfall (a) (b) , 1961-1990 NM NEXRAD Rain (mm) Latitude (Degrees, North) Latitude (Degrees, North) (a) (b) Cloud Top-Tb (K) Introduction The objective of this study is to develop an ANN algorithm by combining Cloud-Top Tb and CG Lightning and to classify and estimate rainfall intensity for summer thunderstorms in Eastern Arizona, Western New Mexico, and Southern Colorado and Utah. Fig. 5 – Above graphs display in New Mexico, the daily mean precipitation for the Hollomon AFB, during 1961-1990 (a) and the flash floods events, during 1959-1998 (b). Longitude (Degrees, West) Longitude (Degrees, West) pCGL Peak RS Current nCGL Peak RS Current (c) (d) Preliminary Findings Adding lightning, L, to cloud-top, Tb, could improve rainfall estimates because the L-R relationship has higher correlation than the Tb-R relationship. (a) (b) DEM of Study Area 12km*12km NLDN sensors US NEXRAD Latitude (Degrees, North) Latitude (Degrees, North) CGL Peak Return-Stroke Current (kA) CGL Peak Return-Stroke Current (kA) Future Work • Improve rainfall at higher resolutions using IR-Tb and L. • Cloud classification to derive relationships for different cloud types. • Validate rainfall model estimation. Longitude (Degrees, West) Longitude (Degrees, West) Fig. 3 a, b, c, d – Above images show the comparison between different rainfall patterns at 12km*12km. These figures (b & d ) illustrate higher correlation between rainfall and lightning peak return-stroke current (PRSC). VAISALA TUCSON, ARIZONA Study Area Fig. 2 – NLDN sensors map (a), US NEXRAD map (b). Fig. 1 – Study area. The Fourth Symposium on Southwest Hydrometeorology, Tucson Hilton East Hotel, Tucson, AZ September 20-21, 2007 National Oceanic and Atmospheric Administration - Cooperative Remote Sensing Science and Technology Center