Download
1 / 14
140 likes | 304 Views
Creating Accessible Presentations. DisAbility Section’s Accessibility Committee. Overview. This template is a guide for creating accessible PowerPoint presentations. This template uses fonts, font sizes and color selections, and color contrasts to improve readability.

E N D
Creating Accessible Presentations DisAbility Section’s Accessibility Committee
Overview • This template is a guide for creating accessible PowerPoint presentations. • This template uses fonts, font sizes and color selections, and color contrasts to improve readability.
Font and Presentation Length • Font size of slide title fonts should be 44 pt. or greater. Text fonts should be 36 pt. or greater. • Don’t try to cram too many slides into your presentation. Allow your audience time to read slides.
Text Formatting • Place no more than 6 lines of text on a slide (excluding columns).
Importance of Slide Format • Many people with disabilities use text-based screen reading software and computer devices. • However, graphics cannot be read with screen readers and other text-based devices.
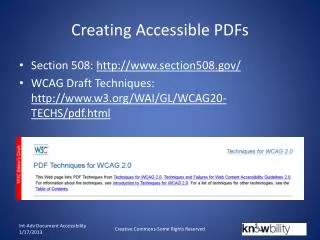
Graphics • Replace graphics with text whenever possible. • Include a text slide after each picture/graph slide that describes what is seen in the picture/graph.
Multimedia • Provide text description of visuals in a multimedia presentation. • Provide captioning of audio for hearing impaired persons. • Ensure that sound is audible from all points in the room.
Avoid • Slide transitions • Busy slide backgrounds • Chart filler patterns • Over-crowding text • Color schemes providing low contrast • Charts without text descriptions
Charts • Use contrasting colors • Use the slide title as the chart title. • Font size for chart labels: 20 pt or greater. • Favor clarity over quantity of content. • Chart description slides.
Text Description for Bar Graph Example • Reading left to right horizontally across columns: • East = 24.4, 27.4, 90.0, 20.4 • West = 30.6, 38.6, 34.6, 31.6 • North = 45.9, 46.9, 45.0, 43.9