Download
1 / 7
80 likes | 189 Views
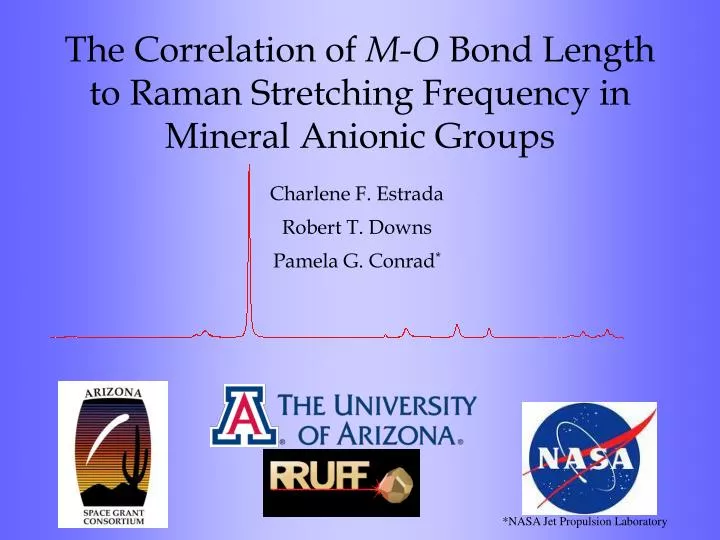
The Correlation of M-O Bond Length to Raman Stretching Frequency in Mineral Anionic Groups. Charlene F. Estrada Robert T. Downs Pamela G. Conrad *. *NASA Jet Propulsion Laboratory. What is Raman Spectroscopy?. A non-destructive method of identifying unknown materials

E N D
The Correlation of M-O Bond Length to Raman Stretching Frequency in Mineral Anionic Groups Charlene F. Estrada Robert T. Downs Pamela G. Conrad* *NASA Jet Propulsion Laboratory
What is Raman Spectroscopy? • A non-destructive method of identifying unknown materials • Energy from an incoming laser causes atoms to oscillate and scatter the incident light • A CCD records the scattered light and it is interpreted as a spectrum CCD
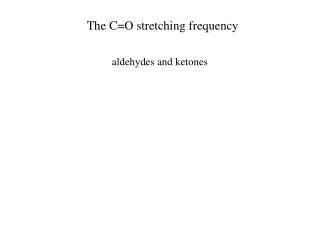
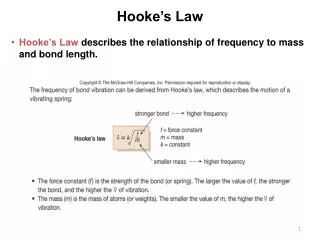
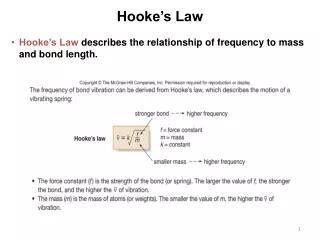
Bond Length and Raman Frequency The Raman frequency of an antisymmetric stretching mode from a metal oxide bond can be correlated to the M-O bond length Strong, short bonds associated with higher frequency stretching modes Weak, long bonds associated with lower frequency stretching modes It has long been assumed that this correlation falls on a simple power curve. But subsequent studies have reported inconsistencies with this pattern. What does the correlation between bond length and Raman frequency really look like?
Our Approach Correlate 774 individual M-O bond lengths in rock-forming minerals with their corresponding Raman stretching frequencies A total of thirteen anionic groups were examined with the following M-O bonds: N-O, C-O, IIIB-O, IVB-O, S-O, P-O, Si-O, Be-O, Cr-O, As-O, V-O, Mo-O, W-O M-O bond lengths were calculated from existing studies on mineral species available through the American Mineral Crystal Structure Database Raman spectra were retrieved from the RRUFF Project Database (http://rruff.info/) Bond length and Raman data plotted in Excel spreadsheet
Results ν = 2359.3 r -1.9376 , R2=.9143 Each anionic group has a separate trend; the location of the M-O cation in the periodic table likely has a strong influence on bond strength
Implications The relationship between Raman frequency and bond length is more complicated than previously assumed. It is unlikely that given only spectroscopic data an unknown mineral’s chemistry can be unambiguously identified. If the unknown sample is suspected to be a specific mineral species with existing bond length data, it may be possible to confirm the identity of the unknown mineral. In spite of the uncertainty in identifying anionic bonds, if a database of all mineral spectra is created, then unknown minerals can be identified by whole pattern matching to existing data.
Acknowledgements Robert T. Downs Pamela G. Conrad G.V. Gibbs The RRUFF Project Team Members The Arizona Space Grant Consortium The NASA Jet Propulsion Laboratory