Download
1 / 30
300 likes | 510 Views
Nonparametric Correlated Groups Tests. Wilcoxon Matched-pairs Signed Ranks Test Sign Test. Alternatives to the Correlated Groups T-test.

E N D
Nonparametric Correlated Groups Tests Wilcoxon Matched-pairs Signed Ranks Test Sign Test
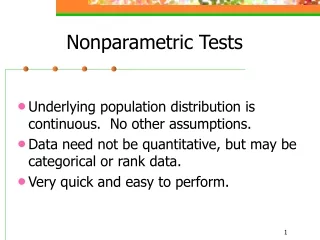
Alternatives to the Correlated Groups T-test • As we have seen for other types of t-tests, there are alternative statistics available for testing differences between correlated groups that do not require the assumption of normality. • The Wilcoxon matched-pairs signed ranks test compares difference in both direction and magnitude of the difference. • The Sign Test compares differences only in terms of direction (plus or minus). • The Wilcoxon matched-pairs signed ranks test is less powerful at detecting statistical differences than is the correlated groups t-test, and the sign test is less powerful than both.
Computing the Wilcoxon matched-pairs test • First, a difference score is calculated for each case by subtracting the actual score for the first variable in the pair from the actual score for the second variable in the pair. If the difference score is zero because the actual scores are the same, the case is dropped from the analysis. • Second, the difference scores are rank ordered from low to high by size, ignoring the sign of the difference scores (I.e. using absolute values) • Third, the ranks associated with the negative difference scores are summed and the ranks associated with the positive difference scores are summed. • Fourth, the probability of the Wilcoxon match-pairs signed ranks test statistic is computed, using the smaller of the total summed ranks in the formula. • Fifth, since the test is always done with the smaller of the summed ranks, we must link the relationship in the research question to the pattern of summed ranks to make certain that our finding is consistent with the relationship we wanted to test.
Problem 1 1. Based on the dataset OMAHA.SAV, is the following statement true, false, or an incorrect application of a statistic? Use 0.05 as the level of significance. Base your answer on the output for the Wilcoxon matched-pairs signed ranks test. For the population represented by this sample, victims of domestic violence in Omaha were less likely to agree that they were a person of worth at one week after the domestic violence incident compared to six months after the domestic violence incident. 1. True 2. True with caution 3. False 4. Incorrect application of a statistic
Request the Wilcoxon matched-pairs test To compute the Wilcoxon match-pairs signed ranks test in SPSS, select the Nonparametric Tests | Related Samples command from the Analyze menu.
Select the specifications for the test First, select the pair of variables for the comparison and move them to the Test Pairs List. Third, click on the OK button to complete the request and produce the output. Second, mark the checkbox for the Wilcoxon test.
Research question related to difference scores Our research question states that victims were less likely to agree at one week compared to six months. This implies that their scores at one week would tend to be lower (e.g. 1 or 2) than their scores at six months (e.g. 3 or 4). To compute the difference scores, we subtract actual scores at week one from actual scores at month six. For example: Subjectone week scoresix months scoredifference score 1 1 (strongly disagree) 2 (disagree) +1 2 2 (disagree) 1 (strongly disagree) -1 3 2 (disagree) 4 (strongly agree) +2 4 1 (strongly disagree) 4 (strongly agree) +3 … If the actual scores at one week are really lower, we would expect to find a larger number of positive difference scores (subjects 1, 3, and 4) than negative difference scores (subject 2).
Research question related to sum of ranks In addition, we would expect the size of the positive difference scores to be larger than the negative difference scores. Since larger difference scores are assigned a higher rank (irrespective of the plus or minus sign), the sum of the ranks associated with the positive difference scores (1.5 + 2 + 3 = 6.5) would tend to be larger than the sum of the ranks associated with the negative difference scores (1.5 = 1.5). Subjectone week scoresix months scoredifference scorerank 1 1 (strongly disagree) 2 (disagree) +1 1.5 2 2 (disagree) 1 (strongly disagree) -1 1.5 3 2 (disagree) 4 (strongly agree) +2 2 4 1 (strongly disagree) 4 (strongly agree) +3 3 …
The research question as a Wilcoxon matched-pairs test hypothesis The question in the problem translates to a test of the research hypothesis for the Wilcoxon match-pairs signed-rank test that the total sum of ranks associated with positive difference scores is larger than the total sum of ranks associated with negative difference scores. The null hypothesis would state that the sum of the ranks associated with positive difference scores is equal to the sum of the ranks for negative difference scores.
The output for Wilcoxon matched-pairs test In the table of ranks, we see that the sum of ranks associated with positive difference scores (7,551) is larger than the sum of ranks associated with negative difference scores (6,110). The sum of ranks supports the direction of the relationship stated in the research hypothesis.
The output for Wilcoxon matched-pairs test Since the hypothesis states a direction, the one-tailed probability for the test statistic is calculated by dividing the two-tailed probability in half: 0.146 / 2 = 0.073 The probability of the test statistic is greater than the level of significance of 0.05. We fail to reject the null hypotheses and cannot support the research hypothesis that the sum of ranks for positive differences was larger, and, therefore, ratings were lower at one week than at six months. The answer to the question is false.
Problem 2 5. Based on the dataset OMAHA.SAV, is the following statement true, false, or an incorrect application of a statistic? Use 0.05 as the level of significance. Base your answer on the output for correlated groups t-test. For the population represented by this sample, victims of domestic violence in Omaha were more likely to agree that they don't have much to be proud of at one week after the domestic violence incident compared to six months after the domestic violence incident. 1. True 2. True with caution 3. False 4. Incorrect application of a statistic
Research question related to difference scores Our research question states that victims were more likely to agree at one week compared to six months, implying that they had higher scores at week one. Higher scores at week one would results in a larger number of negative difference scores when we subtract the larger week one scores from the smaller month six scores. When we rank the difference scores to take size of the differences into account, we would expect the sum of the ranks for negative difference scores to be higher than the sum of the ranks for positive difference scores. The research hypothesis for the Wilcoxon matched-pairs signed ranks test states that the total sum of ranks associated with negative difference scores is larger than the total sum of ranks associated with positive difference scores. The null hypothesis would state that the sum of the ranks associated with negative difference scores is equal to the sum of the ranks for positive difference scores.
The output for Wilcoxon matched-pairs test In the table of ranks, we see that the sum of ranks associated with negative difference scores (12,818) is larger than the sum of ranks associated with positive difference scores (6,488). The sum of ranks supports the direction of the relationship stated in the research hypothesis.
The output for Wilcoxon matched-pairs test Since the test for a directional relationship is a one-tailed test, the probability of the test statistic is calculated by dividing the two-tailed probability in half: 0.000 / 2 = 0.000 The probability of the test statistic is less than the level of significance of 0.05. We reject the null hypotheses and support the research hypothesis that the sum of ranks for negative differences was larger, and, therefore, ratings were higher at one week than at six months. The answer to the question is true.
Is the level of measurement requirement satisfied for the pair of variables? • Paired variables are both ordinal or interval No No Incorrect application of a statistic Yes False Solving Wilcoxon matched-pairs signed ranks problems - 1 The following is a guide to the decision process for answering Wilcoxon matched-pairs signed ranks test problems: Is the probability of the test statistic less than or equal to the level of significance? Yes
No Yes False Yes True Solving Wilcoxon matched-pairs signed ranks problems - 2 Does the direction of the relationship represented by the sum of rank agree with the research question stated in the problem?
The sign test • The sign test compares the number of negative differences in scores between matched pairs to the number of positive differences in scores. • To compute the sign test: • First, a difference score is calculated for each case by subtracting the actual score for the first variable in the pair from the actual score for the second variable in the pair. If the difference score is zero because the actual scores are the same, the case is dropped from the analysis. • Second, the number of positive differences and the number of negative differences are counted. • Third, the probability of the sign statistic is computed, using the larger of the number of positive or negative differences in the formula.
Problem 3 1. Based on the dataset OMAHA.SAV, is the following statement true, false, or an incorrect application of a statistic? Use 0.05 as the level of significance. Base your answer on the output for the sign signed ranks test. For the population represented by this sample, victims of domestic violence in Omaha were less likely to agree that they were a person of worth at one week after the domestic violence incident compared to six months after the domestic violence incident. 1. True 2. True with caution 3. False 4. Incorrect application of a statistic
Request the sign test To compute the sign test in SPSS, select the Nonparametric Tests | Related Samples command from the Analyze menu.
Select the specifications for the test First, select the pair of variables for the comparison and move them to the Test Pairs List. Third, click on the OK button to complete the request. Second, mark the checkbox for the Sign test.
The research question as a sign test hypothesis Our research question states that victims were less likely to agree at one week compared to six months. This implies that their scores at one week would be lower (e.g. 1 or 2) than their scores at six months (e.g. 3 or 4). Subtracting the lower one week scores from the higher six months scores would result in positive difference scores. Our research question translates to a test of the research hypothesis that there will be more positive differences than negative differences. The null hypothesis would state that the number of positive differences is equal to the number of negative differences.
The output for sign test In the table of frequencies, we see that the number of positive differences (90) is greater than the number of negative differences (76). The tally of difference scores supports the direction of the relationship stated in the research hypothesis.
The output for sign test Since the test for a directional relationship is a one-tailed test, the probability of the test statistic is calculated by dividing the two-tailed probability in half: 0.313 / 2 = 0.157 The probability of the test statistic is greater than the level of significance of 0.05. We fail to reject the null hypotheses and cannot support the research hypothesis that there are more positive differences and, therefore, ratings were lower at one week than at six months. The answer to the question is false.
Problem 4 5. Based on the dataset OMAHA.SAV, is the following statement true, false, or an incorrect application of a statistic? Use 0.05 as the level of significance. Base your answer on the output for correlated groups t-test. For the population represented by this sample, victims of domestic violence in Omaha were more likely to agree that they don't have much to be proud of at one week after the domestic violence incident compared to six months after the domestic violence incident. 1. True 2. True with caution 3. False 4. Incorrect application of a statistic
The research question as a sign test hypothesis Our research question states that victims were more like to agree at one week compared to six months. This implies that their scores at one week would be higher than their scores at six months. Subtracting the lower one week scores from the higher six months scores would result in negative difference scores. Our research question translates to a test of the research hypothesis that there will be more negative differences than positive differences. The null hypothesis would state that the number of positive differences is equal to the number of negative differences.
The output for sign test In the table of frequencies, we see that the number of negative differences (130) is greater than the number of positive differences (66). The tally of difference scores supports the direction of the relationship stated in the research hypothesis.
The output for sign test Since the test for a directional relationship is a one-tailed test, the probability of the test statistic is calculated by dividing the two-tailed probability in half: 0.000 / 2 = 0.000 The probability of the test statistic is less than the level of significance of 0.05. We reject the null hypotheses and support the research hypothesis that there more negative ratings and, therefore, ratings were higher at one week than at six months. The answer to the question is true.
Is the level of measurement requirement satisfied for the pair of variables? • Paired variables are both ordinal or interval No No Incorrect application of a statistic Yes False Solving sign test problems - 1 The following is a guide to the decision process for answering sign test problems: Is the probability of the test statistic less than or equal to the level of significance? Yes
No Yes False Yes True Solving sign test problems - 2 Does the direction of the relationship agree with the research question stated in the problem?