Download
1 / 18
180 likes | 305 Views
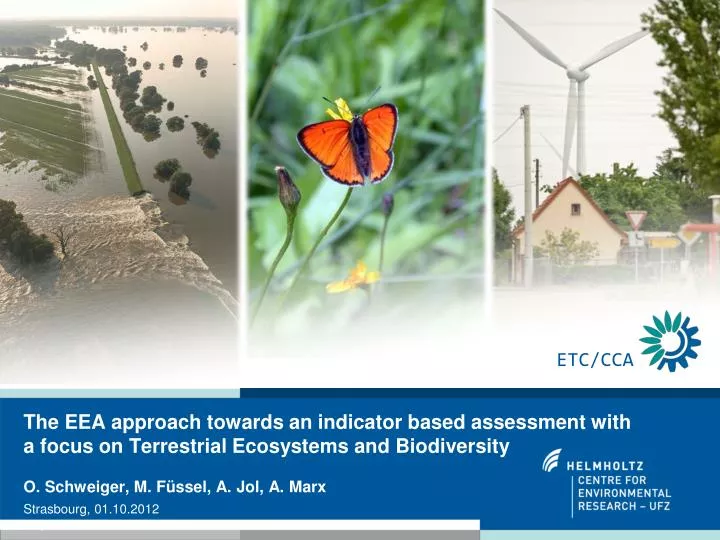
ETC/CCA. The EEA approach towards an indicator based assessment with a focus on Terrestrial Ecosystems and Biodiversity O. Schweiger, M. Füssel , A. Jol , A. Marx Strasbourg, 01.10.2012. Key relevant EU policy processes.

E N D
ETC/CCA The EEA approach towards an indicator based assessment with a focus on Terrestrial Ecosystems and BiodiversityO. Schweiger, M. Füssel, A. Jol, A. MarxStrasbourg, 01.10.2012
Key relevant EU policy processes • Europe 2020 strategy for smart, sustainable and inclusive growth: ‘strengthen our economies' resilience to climate risks’ • Climate change adaptation (Mainstreaming in EU policies, Clearinghouse on adaptation by early 2012, EU strategy by 2013) • Water Framework Directive and Floods Directive • Nature protection directives and policies to halt biodiversity loss • MarineStrategy Framework Directive; Integrated Coastal Zone Management (ICZM) • Other (e.g. sectoral, cross-cutting): maritime, agriculture; forestry; human health; disaster risk reduction; infrastructure e.g. energy, transport (regional policies); urban areas
Impacts of Europe’s changing climate (EEA/JRC/WHO, 2008), update in 2012 • Atmosphere and climate • Cryosphere (glaciers, snow and ice) • Marine biodiversity and ecosystems • Water quantity • Freshwater quality and biodiversity • Terrestrial ecosystems and biodiversity • Soil • Agriculture and forestry • Human health • Vulnerability and economic aspects • (sectors)
Objectives of the 2012 report • Present past and projected climate change and impacts through indicators • Identify sectors and regions most vulnerable/at risk • Increase awareness of need for adaptation actions • Present summary of adaptation actions across Europe • Highlight the need for enhanced monitoring and scenarios at appropriate scale; communication of uncertainties and sharing of information
Europe’s key past and projected impacts and risks (SOER2010), to be updated/extended
Draft scope of the report, main structure • 1. Introduction, EU Adaptation Policy, Indicator selection, Uncertainties • 2. Changes in the climate system • Key climate variables • Cryosphere • 3. Climate impacts on environmental systems • Ocenas and Marine environment • Coastal zones • Inland waters • Terrestrial ecosystems and Biodiversity • Soil • 4. Climate impacts on socio-economic systems and health • Agriculture • Forests and Forestry • Fisheries and aquaculture • Human health • Energy • Transport • Tourism • 5. Vulnerability to climate change • 6. Indicator and data needs
Terrestrial biodiversity indicators • Conservation status • Phenology: Plants and Animals • Species Distribution • plant species • animal species (incl Arctic species index; butterflies and birds) • Species Ecosystem Relationships • Invasive alien species: Examples on plants and animals
Spring trends of phenology in Europe 1971-2000 Note: Each dot represents the mean for spring at a station. Dot size adjusted for clarity. A negative phenological trend corresponds to an earlier onset of spring. Source: (Estrella, Sparks, und Menzel 2009)
Spatial pattern of trend in egg-laying dates of the pied flycatcher 1980-2004 corresponds to temperature trend • Note: Dots: weather stations used to calculate changes in local egg-laying dates (derived from temperature data); triangles: location of pied flycatcher laying date time series. • Source: (Both und Marvelde 2007)
Observed latitudinal shifts of four species over 25 years in Britain Note: Observed latitudinal shifts of the northern range boundaries of species within four exemplar taxonomic groups: Spiders (85 species), ground beetles (59 species), butterflies (29 species), and grasshoppers and allies (22 species). Positive latitudinal shifts indicate movement toward the north (pole); negative values indicate shifts toward the south (Equator). Horizontal lines mark the Median, boxes the 25 to 75% quartile and whisker the range (up to 1.5 times the interqwuartile distance). Open Circles are outliers. Source: Modified after (Chen u. a. 2011)
European variations in the temporal trend of bird and butterfly CTI. • Note: A temporal increase in CTI directly reflects that the species assemblage of the site is increasingly composed of individuals belonging to species dependent on higher temperature. The height of a given arrow is proportional to the temporal trend and its direction corresponds to the sign of the slope (from south to north • for positive slopes). The arrow is opaque if the trend is significant. • Source: Devictoru. a. 2012)
Changes in mammalian species richness until 2100 Note: Units in percentage, changes under two climate scenarios B1 (left) and A2 (right) in a 10’ resolution Source: (Levinsky u. a. 2007)
Projected changes in the climate niche space of the Small Tortoise shell 2050 and 2080 Note: Future distribution of climate niche space of Aglaisurticae under the A2 climate change scenario Northern parts of Europe are expected to remain suitable for the Small Tortoiseshell under all scenarios, but large areas of central Europe would become unsuitable. The worst case loss is 55% of its climatic niche by 2080 under no dispersal or 46% loss under full dispersal. Source: (J. Settele et al., 2008)
Expected average percentage of stable area of 856 plant species for two different climate scenarios 2100 • Note: The S550e scenario corresponds to a stabilisation at 550 ppm CO2 equivalent and a global mean temperature increase of 2°C, the baseline scenario corresponds to a global mean temperature increase of more than 3°C. • Source: (Alkemade, Bakkenes, und Eickhout 2011)
Actual and potential future alien plant invasion hotspots (2081-90) under two extreme climate scenarios • Note: Potential future alien plant invasion hotspots in Germany and Austria under climate change, based on total 30 invasive alien vascular plant species. ColorsColours mark number of invasive alien species being at least suitable in an area. • Source: (Kleinbauer u. a. 2010)
Spatial mismatches of the Portuguese Dappled White butterfly (Euchloetagis) and its host plants • Note: future simulation under BAMBU (Business-As-Might-Be-Usual, Climate A2) scenario. • Source: (Oliver Schweigeret al. 2012)