1 / 0

Markets: Supply and Demand

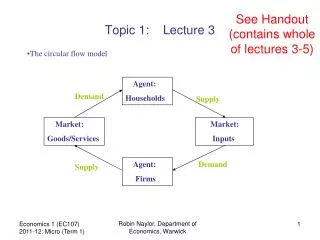
Markets: Supply and Demand. Markets. Market : A group of buyers and sellers of a certain good or service Competitive Market : Many buyers and many sellers so each has small if any impact on the price Role of Price: information -“price signal”.

kare
Download Presentation

Markets: Supply and Demand

An Image/Link below is provided (as is) to download presentation Download Policy: Content on the Website is provided to you AS IS for your information and personal use and may not be sold / licensed / shared on other websites without getting consent from its author. Content is provided to you AS IS for your information and personal use only. Download presentation by click this link. While downloading, if for some reason you are not able to download a presentation, the publisher may have deleted the file from their server. During download, if you can't get a presentation, the file might be deleted by the publisher.

E N D

Presentation Transcript


  1. Markets: Supply and Demand

  2. Markets Market : A group of buyers and sellers of a certain good or service Competitive Market : Many buyers and many sellers so each has small if any impact on the price Role of Price: information -“price signal”
  3. Perfectly Competitive Market: many buyers and sellers – none have any influence over the market price Everybody is a price taker Monopoly : only one seller, so sets the price Monopsony : only one buyer, so sets the price Other markets: somewhere between these extremes
  4. Demand Quantity demanded Amount of a good buyers are willing and able to purchase at a certain price Law of demand Other things equal (ceteris paribus) when the price of the good rises the quantity demanded of a good falls
  5. Demand Schedule/Curve : one a table, the other a graph Both represent the relationship between price and quantity demanded Individual Demand : Demand of a single individual We will focus on linear demand curves: A simplifying assumption
  6. Sara’s Demand Schedule and Demand Curve Price $3.00 $2.00 $1.00 1 2 3 4 5 6 Quantity Note: we say price affects quantity – Q=f(P) but price is on “y” axis – comes from historical perspective and fish markets – Marshal?
  7. Market Demand : Sum of all individuals’ demand in that market Market Demand Curve : Sum up individual demand curves horizontally Market Demand Schedule
  8. Market Demand Curve Creation Sara’s Demand David’s Demand Market Demand Price Price Price $3.00 $3.00 $3.00 $2.00 $2.00 $2.00 $1.00 $1.00 $1.00 4 6 8 12 12 18
  9. More on Demand Curves Shifts in Demand Increased Demand Anything that increases the quantity demanded at all prices Curve shifts to the right Decreased Demand Anything that decreases the quantity demanded at all prices Curve shifts to the left Note: Difference between change in quantity demanded and shift in demand
  10. Change in Demand vsChange in Quantity Demanded P Increased Demand Change in quantity demanded Change in Demand Decreased Demand Q
  11. What things shift demand (change demand) Income Price of related goods Tastes Expectations Number of buyers
  12. On Effect of Income Normal Good: When income goes up demand goes up When income goes down demand goes down Inferior Good: When income goes up demand goes down When income goes down demand goes up
  13. On Effect of Related Goods Substitutes (need 2 goods): An increase in the price of one leads to an increase in demand for the other A decrease in the price of one leads to an decrease in demand for the other Compliments (need 2 goods): An increase in the price of one leads to an decreasein demand for the other A decrease in the price of one leads to an increasein demand for the other
  14. Tastes: Like it more, increase demand Expectations: What you think might happen in the future (income, price changes) can affect current demand Number of buyers: more buyers, increase demand
  15. Remember The Difference Change in price – Change in quantity demanded (movement along demand curve) Change in all others (income, tastes, price of other goods, etc.) – Change in demand (shift in demand curve)
  16. Example Reducing Soda Consumption Tax sugar – will increase the price Leads to a movement along the demand curve Education On Healthy Diet – will change tastes Lead to a shift in the demand curve
  17. Shift in demand due to change in tastes P P’’ Movement along demand due to change in price Tax P’ Q’’’ Q’’ Q’ Q
  18. Supply Quantity Supplied: Amount of the good that suppliers are willing and able to supply at a specific price Law of Supply: All other things being equal, if price goes up quantity supplied will go up
  19. Supply Schedule/Curve : one a table, the other a graph Both represent the relationship between price and quantity supplied Individual Supply : Supply of a single individual/firm (seller) We will focus on linearsupply curves: A simplifying assumption
  20. Starbuck’s Supply Schedule and Supply Curve Price $3.00 $2.00 $1.00 1 2 3 4 5 6 Quantity
  21. Market Supply : Sum of all suppliers individual supply in that market Market Supply Curve : Sum up individual supply curves horizontally Market Supply Schedule
  22. Market Supply Curve Creation (sort of) Starbuck’s Supply Seattle’s Supply Market Supply Price Price Price $3.00 $3.00 $3.00 $2.00 $2.00 $2.00 $1.00 $1.00 $1.00 2 6 4 12 6 18
  23. More on Supply Curves Shifts in Supply Increased Supply Anything that increases the quantity suppliedat all prices Curve shifts to the right Decreased Supply Anything that decreases the quantity supplied at all prices Curve shifts to the left Note: Difference between change in quantity supplied and change in supply
  24. Change in Supply vsChange in Quantity Supplied P Increased Supply Change in quantity supplied Decreased Supply Change in Supply Q
  25. What things shift supply curve (change supply) Price of inputs: input prices go up, supply goes down Technology: better tech., increase in supply Expectations: beliefs about future can affect current supply Number of sellers: more sellers increases supply Again remember difference between change in supply (shift of curve) and change in quantity supplied (movement on curve)
  26. Equilibrium Market equilibrium: when markets “clear”, quantity demanded = quantity supplied Equilibrium price: the price at which the market clears Equilibrium quantity: the amount of the good bought/sold at the equilibrium
  27. Equilibrium Between Demand and Supply P Market Demand Market Supply Equilibrium Price Equilibrium $1.50 Equilibrium Quantity 9 Q
  28. Out of Equilibrium Surplus: excess supply Quantity supplied > quantity demanded Downward pressure on price to clear market Shortage: excess demand Quantity demanded > quantity supplied Upward pressure on price to clear market Note difference between shortage and scarcity
  29. Shortage and Surplus Excess Supply Excess Demand P Demand Surplus Supply Supply Price higher than eq. price Price lower than eq. price Demand Shortage Quantity Supplied Quantity Demanded Quantity Demanded Quantity Supplied Q
  30. Changes to Equilibrium Analyzing Changes in the market after some “shock” or change 1st is supply changed, is demand changed How is it changed Graphically make the change and determine new equilibrium Beware of drawing conclusion based on scale
  31. Example: Study finds eating ice-cream increases students GPA What happens? – Demand increases, quantity supplied increases Demand Increases Price increased in mkt Quantity increased in mkt P’’ New Eq. Quantity Supplied Increases Original Eq. P’ Q’ Q’’
  32. Example: Study finds eating ice-cream increases students GPA and price of sugar goes up What happens? – Demand increases, Supply Decreases Demand Increases New Eq. Supply Decreases P’’ Price increased in mkt Quantity increased in mkt But: b/c of scale Original Eq. P’ Q’ Q’’
  33. Example: Study finds eating ice-cream increases students GPA and price of sugar goes up What happens? – Demand increases, Supply Decreases New Eq. P’’ Supply Decreases Demand Increases Price increased in mkt Quantity decreased in mkt But: b/c of scale Original Eq. P’ Q’’ Q’
  34. So in analyzing market changes be careful of possible ambiguous answers If supply and demand both change do their changes have the same qualitative effect on price/quantity If the same then effect is known If different the effect depends on which is larger
More Related