Download
1 / 68
680 likes | 685 Views
This report presents the findings from the Victims of Crime Survey 2012, which examines crime from the perspective of the victims. It includes information on public perceptions about crime and safety, incidence rates of different crimes, and the effectiveness of law enforcement and judicial systems. The report provides comprehensive data on the dynamics of crime in South Africa and aims to inform policy development and crime prevention strategies.

E N D
Victims of Crime Survey VOCS 2012
Structure of the program • Strategic direction with crime statistics • General Overview • Detailed findings of VOCS 2012 (reference period 2011)
CRIME Statistics task team. Where are we? Pilot diagnostics assessment to understand the Statistical Value Chain in the compilation of crime statistics in October 2012. International bench-marking exercise undertaken to UK and US Crime definitions manual approved by the then acting national commissioner Draft crime counting rules document to be finalized A report on the recommendations on improvements on the crime stats value chain finalized Crime Stats data quality policy presented to the Acting National Commissioner and the Deputy Minister Draft standards on Counting rule error rate Crime Classification error rate Non-registration of crime Formed a task team for the development of Crime Capturing system Draft business case for the system developed.
Comparing data from Administrative and surveys Is the iceberg changing in size or is the sea level changing? Reported crime is immediate and investigated, but.... does not include unreported crimes. Provides a lot of details about specific incidents of victimisation from the victims perspective and identify extent of unreported crime, but.... is influenced by memory loss, circumstances of interview, fear of further victimisation, cultural practices, sampling limitations and errors etc. Neither sufficient on its own and complimentarily needs to be capitalised on.... Source: Angela Me, UNODC, Vienna
Percentage of households prevented from engaging in daily activities when alone because of fear of crime
Perceptions about the reasons why perpetrators of property crimes commit property crimes
Percentage satisfied with the performance of the police (2010 compared with 2011)
Reasons why the dissatisfied are dissatisfied with the courts
Layout 1.Introduction 2. Objectives 3. Methodology 4. Limitations 5. Definitions 6. Results: • Public perceptions about crime and safety • Feeling of safety • Views about crime • Public’s response to crime • Perceptions about victim support services • Public’s perception about police • Perceptions about courts • Victimisation rates in 2011 • Vehicle related crimes and corruption • Burglary and other theft
Introduction • The Victims of Crime Survey (VOCS) is a countrywide household-based survey that examines crime from the point of view of the victim(s). • The Human Sciences Research Council (HSRC) has been conducting studies on crime for the past 20 years, but these do not focus specifically on victims. • The first Victims of Crime survey (VOCS) was conducted by Statistics South Africa (Stats SA) in 1998. The Institute for Security Studies (ISS) conducted the 2003 and 2007 versions of the VOCS. • Stats SA continued to run the survey from 2010 onwards. Objectives of VOCS are: • Provide information about the dynamics of crime from the perspective of households and the victims of crime. • Explore public perceptions of the activities of the police, prosecutors, courts and correctional services in the prevention of crime and victimisation. • Provide complimentary data on the level of crime within South Africa (SA) in addition to the statistics published annually by the South African Police Service (SAPS).
Methodology • Target population: The survey is conducted annually in all nine provinces and the data will be used for the development of policies and strategies, as well as crime prevention and public education programmes. • A representative national sample of approximately 30 000 Dwelling Units (DUs) has been drawn from the 3 080 Primary Sampling Units (PSUs) that form the current master sample. • The master sample is based on the 2001 Population Census Enumeration Areas (EAs). • Approximately 1-15 dwelling units have been randomly sampled from each PSU and all the households residing within these sampled dwelling units will be enumerated • The questionnaire was categorised into household and individual crimes • Survey period: January to March 2012 • The reference period is January to December 2011 unless otherwise stated
Limitations • Victimisation surveys are likely to produce higher crime estimates than police-recorded administrative data • Records may also be subject to undercounting particularly for incidents of a sensitive nature (e.g. Sexual offences) • The accuracy of statistics is influenced by the ability of people to recall past victimisations
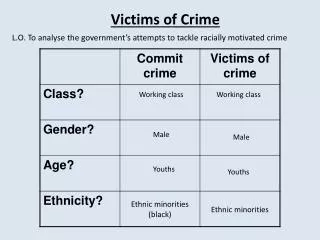
Definitions • Household crimes: crimes committed against the household • Property crime/non-violent: crime where a persons property was threatened but not the person • Violent crime: crimes where a person was threatened, injured or killed • Individual crimes: affect a single person rather than an entire household
Top six crimes perceived by households to be the most common and feared in South Africa, 2011 • About 60% of households perceived housebreaking as the most • common crime • Followed by home robbery (46,2%), street robbery (41,4%) and pick-pocketing (32,1%)
Perceptions of changes in violent crime levels during the period 2009 to 2011 in the households' place of residence (per cent), 2011 • 33,1% of households believed that violent crimes in their area had increased during the three years (2009 to 2011) • 38,1% of households believed that the level of violent crime decreased • Households from Gauteng (49,1%) and Mpumalanga (48,3%) think that crime levels decreased during the three years preceding the survey
Percentage of households who feel safe walking alone in their area during the day/ at night. • Decreased in number of households who feel safe walking alone in their area during the day (85,7%) in 2011 as compared to (88,2%) in 2010 • Slightly decrease in number of households who feel safe walking alone in their area at night (36,6%) in 2011 as compared to (37,0%) in 2010.
100,0 90,0 80,0 70,0 60,0 50,0 Percentage 40,0 30,0 20,0 10,0 0,0 WC EC NC FS KZN NW GP MP LP RSA 56,0 48,8 54,2 56,9 49,0 59,0 59,5 52,1 47,7 53,7 Male 24,4 39,8 32,7 34,6 38,5 32,4 22,0 31,4 41,0 31,9 Female Percentage of households who feel safe walking alone in their area during the day by province and gender of the head of the household, 2011 • 53,7% of male headed households more than 31,9% female headed households reported feeling safe when walking alone during the day • Limpopo had the highest proportion of female headed households that indicated feeling safe while alone in their area during the day (41%), followed by Eastern Cape (39,8%) and KwaZulu-Natal (38,5%)
Percentage of households who feel safe walking alone in their area when it is dark by province and gender of the head of the household, 2011 • 23,4% of male headed households felt safe walking alone in their area when it is dark as compared to 13,1% of female headed households • Northern Cape had the highest percentage (32,2%) of male headed households that felt safe walking alone at night, followed by the Western Cape with 28,5% and KwaZulu-Natal (26,9%)
Percentage categories of households who felt very unsafe walking alone when it is dark by province, 2011
Views on where those most likely to commit property and violent crime live (per cent), 2011 • About six in ten of households believed that property and violent crimes were likely to be committed by people from their area • About 32% believed crimes were committed by people from other areas • 6,3% thought that the perpetrators of crime in their neighbourhoods were people from outside South Africa
Views of households on why perpetrators of property crime commit it (per cent), 2011 • 66,5% of the households believe that people commit property crime to fulfill their drug needs • 56% think they need to do so for survival
Views of households on what government should spend money on in order to reduce crime (per cent), 2011 • 66,8% of households were of the view that social and/or economic development is the more effective way of reducing crime • Just less than twenty percent of households indicated that more money should be spent on law enforcement in order to combat crime
Institutions or groups of people to be contacted first to come to the household’s rescue in the event of being victimised (per cent), 2011 • Just below 60% of households would first contact the police if they became victims of crime • 16,5% would first contact a friend to come to their rescue
Percentage of households who knew where to take someone to access selected services if he/she was a victim of crime by institution & province, 2011 • 91,5% of the households knew where to take someone to access medical services services if they fell victim to violent crime • 53,3% of the households knew where to take someone to access counselling services services if they fell victim to violent crime
Percentage of households who knew where to take someone to access medical services by institution & population group of the household head, 2011 • 77,7% of households would take a victim of crime to access medical services to a hospital or trauma unit • 72%) said they would go to a local clinic to access medical services • Compared to other population groups, black African households are the least likely to go to a private doctor and most likely to go to a local clinic.
Percentage of households who knew of a place of safety/shelter where they can take someone who was a victim of domestic violence by institution and province, 2011 • 53,% of households would take victims of domestic violence to a state run institution to get assistance • 33% of households would take the victim of domestic violence to an NGO