Download

1 / 9
90 likes | 232 Views
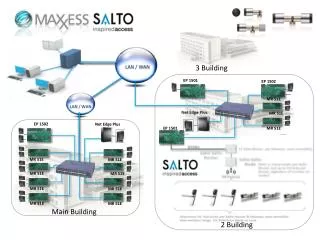
LAN and WAN Monitoring at SLAC. Connie Logg September 21, 2005. 4 Main Areas. LAN Internet Traffic Monitoring via Netflow Traffic types and quantity primary sources & destinations WAN Performance Testing and Analysis PINGER. LAN Monitoring. “model” the network to understand connectivity

E N D
LAN and WAN Monitoring at SLAC Connie Logg September 21, 2005
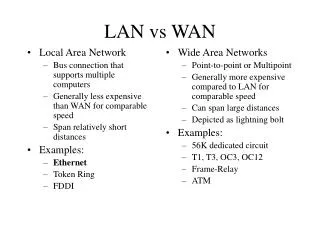
4 Main Areas • LAN • Internet Traffic Monitoring via Netflow • Traffic types and quantity • primary sources & destinations • WAN Performance Testing and Analysis • PINGER
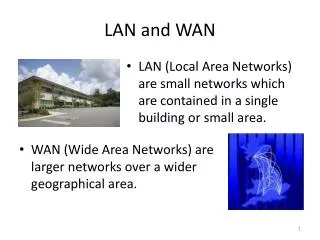
LAN Monitoring • “model” the network to understand connectivity • I/O byte/packet counts, errors, discards, broadcast and multicast stats for all the active connections on the SLAC network • Each connection has its own web page • Allocation of endpoints and address space – summary page
Internet Traffic Monitoring Analyze Netflow records to determine • Types of traffic – Daily summary page • Major external and internal sources of traffic
WAN Performance Measurement and Analysis • IEPM-BW (since 2001) – distributed to (CERN, CALTECH, BNL, NIIT, FNAL & SLAC) • Runs periodic probes to defined targets around the world – low bandwidth links only run traceroute and ping • reports are generated of the performance seen • Data from monitoring is analyzed for anomalies (email alerts generated)
Email Alert Report Example From: Connie Logg [iepm@slac.stanford.edu] Sent: Saturday, September 17, 2005 6:45 PM To: Logg, Connie A.; Cottrell, Les; Nazir, Fawad Subject: iepm-bw.slac.stanford.edu Alert: (node1.dl.ac.uk,tlaytcp) Traceroute Summary Table for Today node1.dl.ac.uk BANDWIDTH DROP Date: 09/16/2005, Time = 23:34:24, %drop=97.9, Past (mean, stdev) = (37.9, 16.1) Trigger (mean,stdev) = (0.8,0.2) Graph of all the data Additional Information for Node= node1.dl.ac.uk, probetype = tlaytcp At epoch time = 1126938864, 09/16/2005 23:34:24
PINGER • Started in 1992 – to check connectivity with our collaborators • With DOE funding it was developed further and extended to monitoring the world • In heavy use today (30 monitoring nodes) • Total: 3665 pairs to 1010 remote nodes at 726 sites in 123 countries (8/05) • Very useful for monitoring the digital divide and baselining connectivity around the world
C. Asia, Russia, S.E. Europe, L. America, M. East, China: 4-5 yrs behind India, Africa: 7 yrs behind World “Quality” S.E. Europe, Russia: catching up Latin Am., Mid East, China: keeping up India, Africa: falling behind Important for policy makers Many institutes in developing world have less performance than a household in N. America or Europe
Additional Information • LAN • Quick Guide (links not visible outside of SLAC) • Internet Traffic • Netflow Analysis • IEPM-BW WAN Monitoring • Report • PINGER • Network Monitoring for SCIC