Download
1 / 1
10 likes | 163 Views
Syk. Lyn, Hck. GRK2 (4,5,6). P2Y2,6. C5aR. CD64. Arrestin 2,3. PI3K p85 a , p110 a,d. Gi3. G a i 2, 3. G a q, G a 11. PTEN. SHIP1. UCIP. G b 1, 2 ( 4 ,5). p101, p110 g. SHIP-2 (1). 188. PLC b 2,3 (4). PLC g 1,2. 98. Btk, Tec. Akt1,2,3. IB: SHIP1. IP3KTB(C). IP3R1,2,3.

E N D
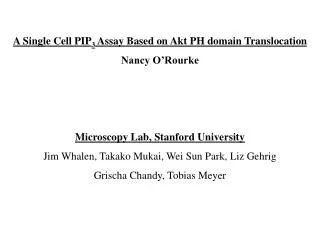
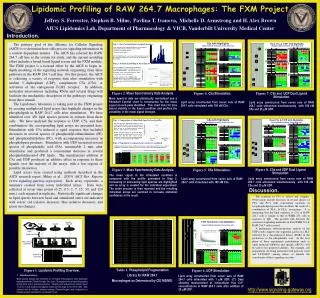
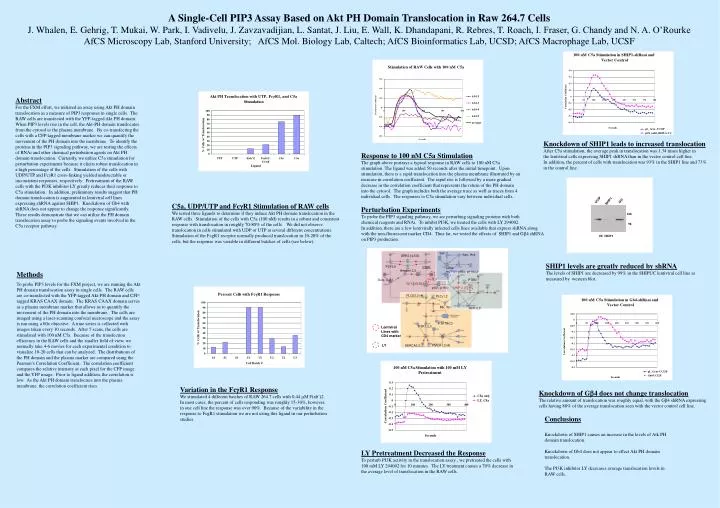
Syk Lyn, Hck GRK2 (4,5,6) P2Y2,6 C5aR CD64 Arrestin 2,3 PI3K p85a, p110a,d Gi3 Gai2,3 Gaq, Ga11 PTEN SHIP1 UCIP Gb1,2 (4,5) p101, p110g SHIP-2 (1) 188 PLCb2,3 (4) PLCg1,2 98 Btk, Tec Akt1,2,3 IB: SHIP1 IP3KTB(C) IP3R1,2,3 Lentiviral Lines with CD4 marker LY PMCA1,3 (4) SERCA2,3 A Single-Cell PIP3 Assay Based on Akt PH Domain Translocation in Raw 264.7 Cells J. Whalen, E. Gehrig, T. Mukai, W. Park, I. Vadivelu, J. Zavzavadijian, L. Santat, J. Liu, E. Wall, K. Dhandapani, R. Rebres, T. Roach, I. Fraser, G. Chandy and N. A. O’Rourke AfCS Microscopy Lab, Stanford University; AfCS Mol. Biology Lab, Caltech; AfCS Bioinformatics Lab, UCSD; AfCS Macrophage Lab, UCSF Abstract For the FXM effort, we initiated an assay using Akt PH domain translocation as a measure of PIP3 responses in single cells. The RAW cells are transfected with the YFP-tagged Akt PH domain. When PIP3 levels rise in the cell, the Akt-PH domain translocates from the cytosol to the plasma membrane. By co-transfecting the cells with a CFP-tagged membrane marker we can quantify the movement of the PH domain into the membrane. To identify the proteins in the PIP3 signaling pathway, we are testing the effects of RNAi and other chemical perturbation agents on Akt PH domain translocation. Currently, we utilize C5a stimulation for perturbation experiments because it elicits robust translocation in a high percentage of the cells. Stimulation of the cells with UDP/UTP and FcgR1 cross-linking yielded undetectable or inconsistent responses, respectively. Pretreatment of the RAW cells with the PI3K inhibitor LY greatly reduces their response to C5a stimulation. In addition, preliminary results suggest that PH domain translocation is augmented in lentiviral cell lines expressing shRNA against SHIP1. Knockdown of Gb4 with shRNA does not appear to change the response significantly. These results demonstrate that we can utilize the PH domain translocation assay to probe the signaling events involved in the C5a receptor pathway. Knockdown of SHIP1 leads to increased translocation After C5a stimulation, the average peak in translocation was 1.34 times higher in the lentiviral cells expressing SHIP1 shRNA than in the vector control cell line. In addition, the percent of cells with translocation was 93% in the SHIP1 line and 73% in the control line. Response to 100 nM C5a Stimulation The graph above portrays a typical response in RAW cells to 100 nM C5a stimulation. The ligand was added 50 seconds after the initial timepoint. Upon stimulation, there is a rapid translocation into the plasma membrane illustrated by an increase in correlation coefficient. The rapid rise is followed by a more gradual decrease in the correlation coefficient that represents the return of the PH domain into the cytosol. The graph includes both the average trace as well as traces from 4 individual cells. The responses to C5a stimulation vary between individual cells.. C5a, UDP/UTP and FcgR1 Stimulation of RAW cells We tested three ligands to determine if they induce Akt PH domain translocation in the RAW cells. Stimulation of the cells with C5a (100 nM) results in a robust and consistent response with translocation in roughly 70-80% of the cells. We did not observe translocation in cells stimulated with UDP or UTP at several different concentrations. Stimulation of the FcgR1 receptor normally produced translocation in 10-20% of the cells, but the response was variable in different batches of cells (see below). Perturbation Experiments To probe the PIP3 signaling pathway, we are perturbing signaling proteins with both chemical reagents and RNAi. To inhibit PI3K, we treated the cells with LY 294002. In addition, there are a few lentivirally infected cells lines available that express shRNA along with the non-fluorescent marker CD4. Thus far, we tested the effects of SHIP1 and Gb4 shRNA on PIP3 production. SHIP1 levels are greatly reduced by shRNA The levels of SHIP1 are decreased by 99% in the SHIPUC lentiviral cell line as measured by western blot. Methods To probe PIP3 levels for the FXM project, we are running the Akt PH domain translocation assay in single cells. The RAW cells are co-transfected with the YFP-tagged Akt-PH domain and CFP-tagged KRAS CAAX domain. The KRAS CAAX domain serves as a plasma membrane marker that allows us to quantify the movement of the PH domain into the membrane. The cells are imaged using a laser-scanning confocal microscope and the assay is run using a 60x objective. A time series is collected with images taken every 10 seconds. After 5 scans, the cells are stimulated with 100 nM C5a. Because of the transfection efficiency in the RAW cells and the smaller field of view, we normally take 4-6 movies for each experimental condition to visualize 10-20 cells that can be analyzed. The distributions of the PH domain and the plasma marker are compared using the Pearson’s Correlation Coefficient. The correlation coefficient compares the relative intensity at each pixel for the CFP image and the YFP image. Prior to ligand addition, the correlation is low. As the Akt PH domain translocates into the plasma membrane, the correlation coefficient rises. Variation in the FcgR1 Response We stimulated 4 different batches of RAW 264.7 cells with 0.44 mM F(ab’)2. In most cases, the percent of cells responding was roughly 15-30%, however, in one cell line the response was over 90%. Because of the variability in the response to FcgR1 stimulation we are not using this ligand in our perturbation studies. Knockdown of Gb4 does not change translocation The relative amount of translocation was roughly equal, with the Gb4 shRNA expressing cells having 88% of the average translocation seen with the vector control cell line. Conclusions Knockdown of SHIP1 causes an increase in the levels of Atk PH domain translocation. Knockdown of Gb4 does not appear to effect Akt PH domain translocation. The PI3K inhibitor LY decreases average translocation levels in RAW cells. LY Pretreatment Decreased the Response To perturb PI3K activity in the translocation assay , we pretreated the cells with 100 mM LY 294002 for 10 minutes. The LY treatment causes a 70% decrease in the average level of translocation in the RAW cells.