Download
1 / 25
260 likes | 491 Views
San Diego Region Economic Overview. San Diego Regional EDC. Private, non-profit; some fee-for-service public contracts 250 corporate investors 43-year history Business Development + Policy = Economic Development Focused on: Business attraction, retention, expansion

E N D
San Diego Regional EDC Private, non-profit; some fee-for-service public contracts 250 corporate investors 43-year history Business Development + Policy = Economic Development Focused on: Business attraction, retention, expansion Leadership on regional policy issues
Gross Regional Product (billions) Totals adjusted for inflation Source: National University System/San Diego Institute for Policy Research. e = estimate; f = forecast
Gross Regional Product (annual % change) Using constant 2001 dollars; not adjusted for inflation 2001 2002 2003 2004 2005 2006 2007 2008e 2009f Source: National University System/San Diego Institute for Policy Research. e = estimate; f = forecast
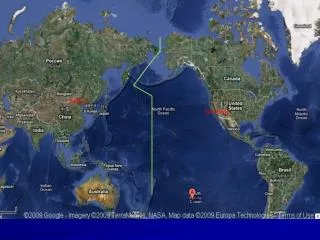
If San Diego Were a Country… 2007 GDP Rank 39. Czech Republic $168.1 Billion 40. Romania $166.0 Billion 41. Nigeria $165.7 Billion San Diego $164.7 Billion 42. Chile $163.9 Billion 43. Israel $161.8 Billion Source: National University System/San Diego Institute for Policy Research; World Bank
Annual Population Growth (thousands) Source: California Department of Finance
City and County Facts 8th Largest U.S. City 17th Largest Metro Area 26th Largest TV Market 84% of Population Lives in the 18 Incorporated Cities 67% of County Off Limits to Development
Traditional Sector Employment ’00-08 Change November 08 Jobs Natural Resources 500 66.7% Agriculture 11,000 -3.5% Construction 77,900 11.8% Manufacturing 100,700 -17.9% Services 1,122,500 12.1% Source: California Employment Development Department
Traditional Sector Employment ’00-08 Change November 08 Jobs Services 1,122,500 12.1% Retail Trade 146,900 9.8% Financial Activities 74,400 4.5% Professional/Business 216,400 10.9% Educational/Health 134,300 16.5% Leisure/Hospitality 161,900 25.5% Government 227,100 9.9% Source: California Employment Development Department
High-Tech Employment Clusters Cluster ’07 Jobs Ave. Wage Biotechnology 39,985 $84,679 Telecommunications 26,606 $119,392 Defense Manufacturing 20,189 $75,328 Software 14,653 $86,784 Computers/Electronics 13,396 $83,414 Total High-Tech Clusters 114,829 n/a Total Non-Farm Jobs 1,308,200 $46,350 Source: San Diego Association of Governments; Rich’s BioScience Directory; California Employment Development Department. Wages in 2007 dollars.
Major Players in San Diego Biotechnology Biogen Idec Gen-Probe Genentech Life Technologies Johnson & Johnson Pfizer Electronics BAE Systems Cohu Hewlett-Packard Sony Sun Microsystems Telecom/IT L-3 Communications Motorola Nokia Qualcomm Inc. ViaSat Software Claritas ESET Intuit Predicate Logic Websense Cleantech Aptera Kyocera Solar Sapphire Energy Synthetic Genomics Defense Cubic General Atomics Goodrich Aerostructures Lockheed Martin General Dynamics NASSCO SAIC Solar Turbines Source: San Diego Business Journal Book of Lists; Rich’s High-Tech Directory
Economic Impact of Clusters (billions) Annual impact in 2007 dollars $12.3 $9.7 $9.7 $9.1 $3.7 Source: San Diego Association of Governments
Venture Capital Funding (millions) Source: PricewaterhouseCoopers MoneyTree Survey; UCSD
VC Funding by Industry (2008) Source: PricewaterhouseCoopers MoneyTree Survey; UCSD
Evolution of a High-Tech Economy • 1903 – Scripps Institution of Oceanography • 1917 – Birthplace of naval aviation: North Island • 1934 – Consolidated Aircraft (Convair) • 1940 – Navy Radio Lab (now SPAWAR) • 1955 – General Atomics • 1959 – UCSD • 1962 – Salk Institute for Biological Studies Source: Scripps Institution of Oceanography; U.S. Navy; “The Future Takes Wing”; SPAWAR; General Atomics; UCSD
Evolution of a High-Tech Economy • 1969 – Linkabit, SAIC • 1978 – Hybritech • 1985 – Qualcomm Inc. • 2000 – Cal-(IT)2 • 2006 – Sanford Consortium for Regenerative Medicine • 2007 – San Diego-EDC cleantech cluster analysis • 2007 – CleanTECH San Diego • 2008 – San Diego-Imperial-Baja Mega-Region Initiative Source: Scripps Institution of Oceanography; U.S. Navy; “The Future Takes Wing”; SPAWAR; General Atomics; UCSD; CleanTECH San Diego
Why San Diego? • 1,000+ biotech, telecom, IT and defense companies • 210+ cleantech companies • UCSD, Scripps Institution of Oceanography • Burnham, Salk, Scripps and other world-class institutes • Science, talent, funding, support services • Legendary spirit of cooperation • Culture of serial entrepreneurism