Download
1 / 6
70 likes | 194 Views
The fall enrollment figures at a community college are shown. 3000. 2897. 2800. 2600. 2465. Enrollment. 2312. 2400. 2200. 2000. 10. 5. 15. Number Of Years Past 1980. Linear Functions: Application. Linear Functions: Application.

E N D
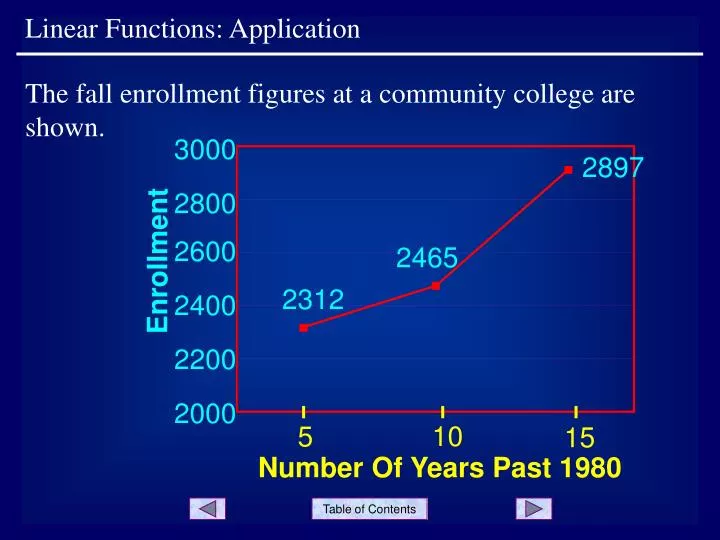
The fall enrollment figures at a community college are shown. 3000 2897 2800 2600 2465 Enrollment 2312 2400 2200 2000 10 5 15 Number Of Years Past 1980 Linear Functions: Application
Linear Functions: Application Use the figures only for 1985 and 1995 to write a linear model (function) for the enrollment, y, in terms of the number of years past 1980, x. The point for 1985 is (5, 2312). The point for 1995 is (15, 2897). First, use these points and the slope formula to find the slope of the line. Substitute one of the points and slope into the point-slope equation, y – yc = m(x – xc), to get: y – 2312 = 58.5(x – 5). Slide 2
Linear Functions: Application Next put, y – 2312 = 58.5(x – 5) in slope-intercept form. y – 2312 = 58.5x – 292.5 y = 58.5x + 2019.5 Use the linear model to predict the enrollment in 2010. The year 2010 corresponds to x = 30 (30 years after 1980). Substitute this into the linear model to get: y = 58.5(30) + 2019.5 = 3774.5 According to the model, the enrollment in 2010 will be 3775 students. Slide 3
The population of a small town for selected years is shown. 25000 24000 23104 23000 Population 22350 22000 20896 21000 20000 9 6 3 Number Of Years Past 1990 Linear Functions: Application Slide 4
Linear Functions: Application Use the figures only for 1993 and 1999 to write a linear model (function) for the town's population, y, in terms of the number of years past 1990, x. y = 368x + 19792 Use the linear model to predict the town's population in 2010. According to the model, the town's population in 2010 will be 27,152. Slide 5
Linear Functions: Application END OF PRESENTATION Click to rerun the slideshow.