Download
1 / 25
250 likes | 337 Views
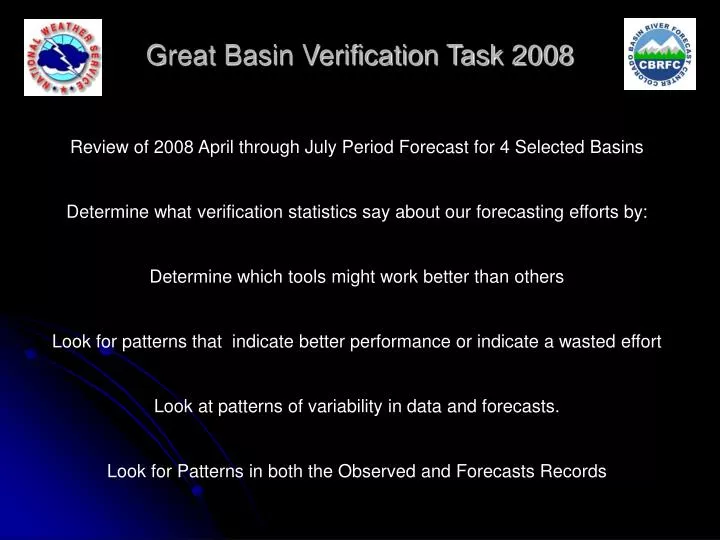
Review of 2008 April through July Period Forecast for 4 Selected Basins Determine what verification statistics say about our forecasting efforts by: Determine which tools might work better than others Look for patterns that indicate better performance or indicate a wasted effort

E N D
Review of 2008 April through July Period Forecast for 4 Selected Basins Determine what verification statistics say about our forecasting efforts by: Determine which tools might work better than others Look for patterns that indicate better performance or indicate a wasted effort Look at patterns of variability in data and forecasts. Look for Patterns in both the Observed and Forecasts Records Increased Variability Great Basin Verification Task 2008
1899-2008 Big Cottonwood Creek Near Salt Lake City, UTHistorical Stream Flow and Forecasts Increased Variability? 1979-2008
Big Cottonwood Creek Near Salt Lake City, UTScatter Plot of Stream Flow Forecasts 1991-2008 Over Forecasting Lows Under Forecasting Highs
Big Cottonwood Creek Near Salt Lake City, UTHistorical Stream Flow and Forecasts Scatter Plots POR Coordinated Forecasts are Consitently Too High 1979-2008 1979-2008 1979-2008
Big Cottonwood Creek Near Salt Lake City, UTRank Histogram 3 times the calculated probability
Big Cottonwood Creek Near Salt Lake City, UTMean Absolute Error Lead Time 26% 14% 6%
1992-2008 Bear River – Near Utah, Wyoming State LineHistorical Stream Flow 1992-2008 1942-2008
1992-2008 Bear River – Near Utah, Wyoming State Line Scatter Plot of Stream Flow vs Forecast Values 2001-2008
Bear River – Near Utah, Wyoming State Line 1942-2008 1986 1977 1992-2008
2001-2008 Bear River – Near Utah, Wyoming State LineSkill Score – 2 periods 1992-2000
1992-2000 Bear River – Near Utah, Wyoming State Line Rank Histogram 2001-2008
Logan River Near Logan, UtahHistorical Stream Flow & Forecasts 1983-2007 1900-2008 1986 1958-1970 2000
2001-2008: SWS seems to be over forecasting. Logan River Near Logan, UtahHistorical Stream Flow & Forecasts 1990-2008: Forecast POR
1991-2008 Logan River Near Logan, UtahScatter Plot of Forecasts Split Distribution of Values 1979-2008 Distribution move evenly space going back to 1971
Logan River Near Logan, UtahRank Histogram 1991-2008 1991-2008 Over Forecasting Less Frequently in the 90% Exceedance Region than in the 10% Region. Under Forecasting more Frequently in the Region of the 10% Exceedance Probability
Logan River Near Logan, UtahRank Histogram 2001-2008 2001-2008 Worse than Predicted Values when Forecasting High Flows. Improved Stats Using the most recent years Better than Predicted forecasting of low flows
Logan River Near Logan, UtahPOD Above / POD Below Threshold for POR Good POD of Volumes Below Threshold, except SWS in Jan, Feb. Consistently Lower POD “Above Threshold” - No Matter the Month
Logan River Near Logan, UtahMean Absolute Error – Lead Time 44kaf 28kaf 25kaf 23kaf 18kaf 13kaf
1990-2008 Weber at Oakley, UtahHistorical Stream Flow and Forecasts 7 of Top 10 A-J Flows Occurred Before 1922
2001-2008 ~ Using New Averages Seems To have Improved our Forecasting Efforts Weber at Oakley, UtahHistorical Forecast Plots 1990-2000 ~ Prior to ESP and New Averages Under Forecasting was a Consistent Problem
Weber at Oakley, UtahScatter Plot of Forecast vs Observed 1990-2008, no forecast were made prior to 1990 Clearly Under Forecasting the High Years
Weber at Oakley, UtahMean Absolute Error Lead Time 38kaf 9kaf
Findings indicate we detect low flows better than high flows with current and often over forecast the 10% exceedance values. Some Statistics Suggest that SWS often forecast too high in comparison to NWS, NRCS and ESP Forecasts That coordinated forecast numbers are skewed and result in over forecasting. That many of the data sets from 1991-2008 have a binary split indicating that more extremes have occurred in observed flows during the last 20 years. MOST IMPORTANTLY That our forecasting efforts have improved since 2001. Increased Variability ConclusionsGreat Basin Verification Task 2008