Download
1 / 22
220 likes | 312 Views
Climate Change Projection Impact on Soil Carbon and Other Environmental Indicators for the Upper Mississippi River Basin. Philip W. Gassman & Manoj Jha CARD, Dept. of Economics, Iowa State Univ. Chris Anderson, Eugene S. Takle, & Richard M. Cruse Dept. of Agronomy, Iowa State Univ.

E N D
Climate Change Projection Impact on Soil Carbon and Other Environmental Indicators for the Upper Mississippi River Basin Philip W. Gassman & Manoj Jha CARD, Dept. of Economics, Iowa State Univ. Chris Anderson, Eugene S. Takle, & Richard M. Cruse Dept. of Agronomy, Iowa State Univ.
Introduction • Extensive number of studies of climate change impacts on hydrology and crop production • Less research on climate change impacts on soil carbon, soil erosion, etc. • Interested in using recent climate change projections in environmental models
General Modeling Approach • Coupled Atmospheric-Ocean General Circulation Models (AOGCMs) - new projections recently generated • Link climate outputs to models used at CARD - Soil and Water Assessment Tool (SWAT) watershed model - Environmental Policy Impact Climate (EPIC) model (formerly Erosion Productivity Impact Calculator)
GCM Scenarios • SRES (Special Report on Emission Scenarios) - http://www.grida.no/climate/ipcc/emission/ • assumed trends in GHG emissions to atmosphere • Scenario “Families”: A1, A2, B1, & B2 - A1 subcategories: A1FI, A1T, & A1B • Using A1B and B1 at present
A1B & B1 Scenarios • A1B: rapid economic growth, population that peaks ~2050 and then declines, and rapid development of new & more efficient technologies - B: balance across all energy sources • B1: similar population trend; rapid changes in economic structures resulting in service & information economies, less material intensity, and adoption of clean & resource-efficient technologies
AOGCM Models • Recent output for 2007 IPPC report - contemporary climate (1961-2000) - climate projections; e.g., 2045-64 and 2081-2100 • global scale - coarse grid with grid pointes several hundred km apart • SWAT and EPIC function at much different scales
AOGCM Models • Goddard Institute for Space Studies (GISS) C4x3 model • Geophysical Fluid Dynamics Laboratory (GFDL) versions 2.0 & 2.1 • Model for Interdisciplinary Research on Climate (MIROC) - Centrefor Climate System Research, Univ. of Tokyo
EPIC Overview • Continuous, daily time step, field-scale model -long-term simulations (hundreds of years) • Generic crop growth routine - over 100 crops; crop rotations; simultaneous simulation of up to 12 crops/plants • Outputs: soil carbon, soil erosion, nitrate leaching, nutrient runoff, pesticide losses, etc.
EPIC3060 Carbon Submodel • Improved carbon routines in EPIC3060 based on approach used in Century • Three soil carbon pools: biomass, slow, and passive • Only two surface litter pools: biomass & slow • Existing EPIC routines used for some functions • Outputs: soil carbon levels; leaching & gaseous losses
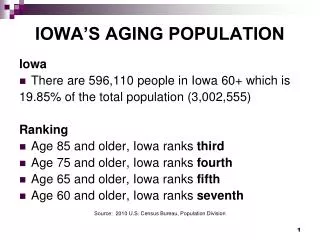
UMRB Studies • Upper Mississippi River Basin (UMRB) - drainage area covers 480,000 km2 -agriculture is the dominant land use (~65%) - stream segments impacted by nutrients, sediments, and other pollutants - numerous TMDLS - Gulf of Mexico seasonal hypoxic zone
UMRB Simulations • SWAT Simulations - alternative land use and management impact on water quality - climate change impacts on UMRB hydrology - two previous studies with earlier projections - preliminary results generated with the new GISS, GFDL, and MIROC projections • EPIC simulations - previous CRP studies - want to look at GISS impacts
Upper Mississippi River Basin Observed GISS GFDL MIROC Upper Mississippi River Basin 131 8-digit watersheds
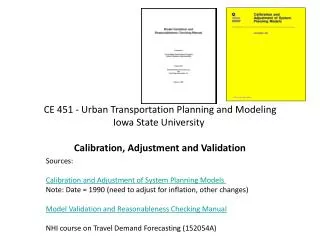
NRI Database • 1997 National Resources Inventory (NRI) - USDA-NRCS national statistical survey (~800,000 “points”) - each point typically represents several hundred ha - spatially identified at State, MLRA, 8-digit HUC, & county - comprehensive cropping history (rotations) & other landuse, conservation practices, and other data • UMRB EPIC application - NRI agricultural areas: cropland, grassland, and Conservation Reserve Program (CRP) areas - simulations performed using interactive EPIC (i_EPIC) software - carbon, soil erosion, and other outputs
Work in Progress • Did generate some output but ... • Need to fix some problems • Brief look at some related work
Targeting of CRP in UMRB • http://www.choicesmagazine.org/2004-3 /index.htm • Goal: assess likely placement of CRP in URMB based on targeting of carbon or soil erosion benefits • Baseline CRP acres based on 1997 NRI
Actual CRP Acres vs. CRP Acres Based on Targeting of Carbon Benefits Targeted Actual
Actual CRP Acres vs. CRP Acres Based on Targeting of Erosion Benefits Targeted Actual