Download
1 / 8

E N D
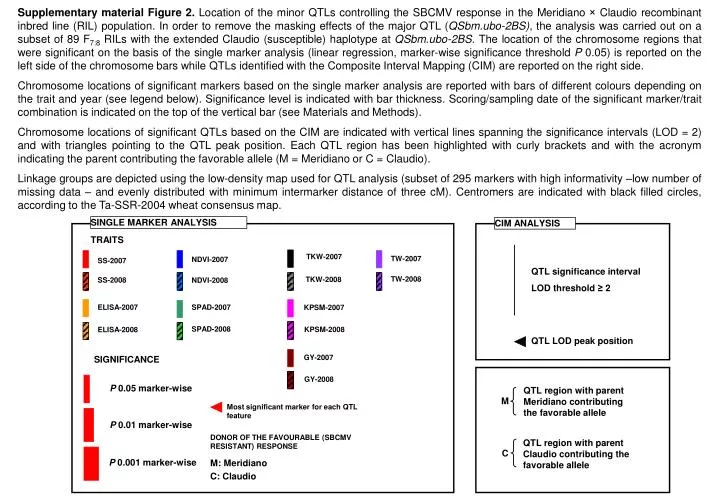
Supplementary material Figure 2. Location of the minor QTLs controlling the SBCMV response in the Meridiano × Claudio recombinant inbred line (RIL) population. In order to remove the masking effects of the major QTL (QSbm.ubo-2BS), the analysis was carried out on a subset of 89 F7:8 RILs with the extended Claudio (susceptible) haplotype at QSbm.ubo-2BS. The location of the chromosome regions that were significant on the basis of the single marker analysis (linear regression, marker-wise significance threshold P 0.05) is reported on the left side of the chromosome bars while QTLs identified with the Composite Interval Mapping (CIM) are reported on the right side. Chromosome locations of significant markers based on the single marker analysis are reported with bars of different colours depending on the trait and year (see legend below). Significance level is indicated with bar thickness. Scoring/sampling date of the significant marker/trait combination is indicated on the top of the vertical bar (see Materials and Methods). Chromosome locations of significant QTLs based on the CIM are indicated with vertical lines spanning the significance intervals (LOD = 2) and with triangles pointing to the QTL peak position. Each QTL region has been highlighted with curly brackets and with the acronym indicating the parent contributing the favorable allele (M = Meridiano or C = Claudio). Linkage groups are depicted using the low-density map used for QTL analysis (subset of 295 markers with high informativity –low number of missing data – and evenly distributed with minimum intermarker distance of three cM). Centromers are indicated with black filled circles, according to the Ta-SSR-2004 wheat consensus map. SINGLE MARKER ANALYSIS CIM ANALYSIS TRAITS TKW-2007 TW-2007 NDVI-2007 SS-2007 QTL significance interval LOD threshold ≥ 2 TW-2008 TKW-2008 SS-2008 NDVI-2008 ELISA-2007 SPAD-2007 KPSM-2007 SPAD-2008 KPSM-2008 ELISA-2008 QTL LOD peak position GY-2007 SIGNIFICANCE GY-2008 P 0.05 marker-wise QTL region with parent Meridiano contributing the favorable allele M Most significant marker for each QTL feature P 0.01 marker-wise DONOR OF THE FAVOURABLE (SBCMV RESISTANT) RESPONSE QTL region with parent Claudio contributing the favorable allele C P 0.001 marker-wise M: Meridiano C: Claudio
50 cM 10 cM Chr. 1B Chr. 1A 4 2-3-4 1-2-3 GY-2008 KPSM-2008 TW-2008 2-3 NDVI-4-2007 2-4 ELISA-2-2008 SPAD-3-2008 SS-1-2007 SS-2-2007 M 3-4 2-4 M 1 1 M 4 M 2 1 2 2-4 4 C 2 4 2-3-4 3-4 M 2
Chr. 2A 50 cM 10 cM Chr. 2B 1 C Sbm2 1-2-3 2 4 2-4 SS-3-2007 SS-2-2008 C KPSM-2-2008 2 4 4 2 1 2-3 C 4 2-4 1-2-3 M 2 2 C
50 cM 10 cM Chr. 3B Chr. 3A 1 2 C 4 4 2-4 2-3 M M 2-3-4 4 4 4 TW-2008 GY-2007 SS-3-2008 4 ELISA-4-2008 4 4 SPAD-2-2008 SPAD-4-2007 KPSM-2007 GY-2007 SS-3-2008 C SS-4-2008 4 2-3-4 1 1-2-4 2 1 1 2 2 M 3-4 4 M 3 C 4 2 2 4 3-4 SS-4-2007 M
50 cM 10 cM Chr. 4A Chr. 4B 3 2 2 M ELISA-2-2007 2 1 M C 4 2 2 M 2 2 4 C 2-4 2 SS-2-2008 M
50 cM 10 cM Chr. 5B Chr. 5A 2 1-3 1-2-3-4 C 2 C 2-4 1-2-4 2-4 2 1 2 GY-2008 TW-2008 ELISA-2-2007 SS-1-2007 SS-2-2007 2 NDVI-2-2007 SPAD-2-2007 SPAD-2-2008 C 2-3 1 C TKW-2007 ELISA-4-2007 2 3 4 C
50 cM 10 cM Chr. 6A Chr. 6B 2-4 2-4 2-4 1-2-3-4 3-4 3-4 SS-3-2008 SS-4-2008 NDVI-4-2008 M 1-2 4 C 2-4 3 1-4 C M 2 1 4 M 2 M 3 4 M 1 1 M
50 cM 10 cM Chr. 7A Chr. 7B 1-3-4 2 SS-2-2007 3-4 2-4 2 M 2 SPAD-2-2007 SPAD-4-2007 2-3-4 1-2-3-4 ELISA-2-2007 4 3 SS-4-2008 C SS-2-2007 SS-1-2007 2 1 1-2-3 TW-2007 4 ELISA-2-2008 ELISA-4-2008 C 2 2 C 2 M