Download
1 / 4
40 likes | 160 Views
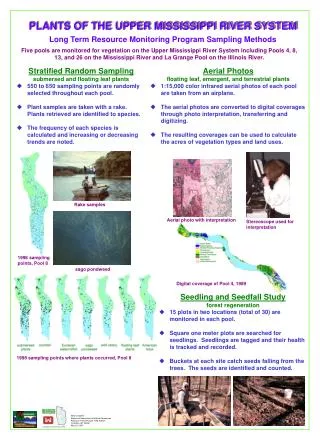
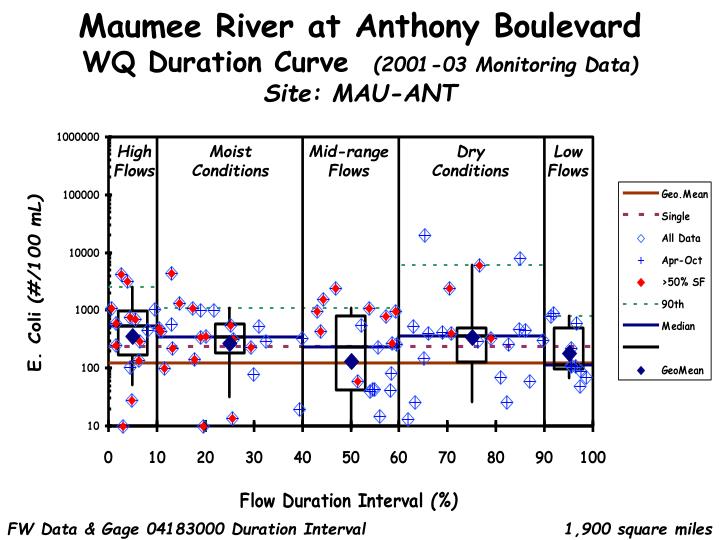
Maumee River at Anthony Boulevard WQ Duration Curve (2001-03 Monitoring Data) Site: MAU-ANT. High Flows. Moist Conditions. Mid-range Flows. Dry Conditions. Low Flows. FW Data & Gage 04183000 Duration Interval. 1,900 square miles.

E N D
Maumee River at Anthony BoulevardWQ Duration Curve (2001-03 Monitoring Data)Site: MAU-ANT High Flows Moist Conditions Mid-range Flows Dry Conditions Low Flows FW Data & Gage 04183000 Duration Interval 1,900 square miles
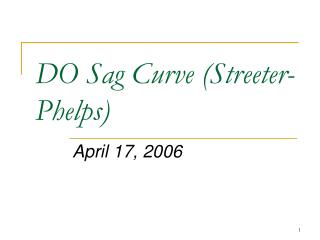
Maumee River at Landin RoadWQ Duration Curve (2001-03 Monitoring Data)Site: MAU-LAN High Flows Moist Conditions Mid-range Flows Dry Conditions Low Flows FW Data & Gage 04183000 Duration Interval 1,967 square miles
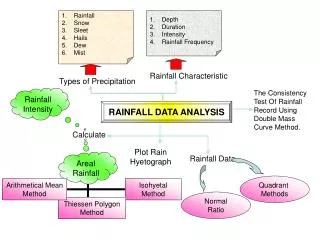
Maumee River at Landin RoadWQ Duration Curve (1991 - 2000 Monitoring Data)Site: M-129 High Flows Moist Conditions Mid-range Flows Dry Conditions Low Flows IDEM Data & Gage 04183000 Duration Interval 1,967 square miles
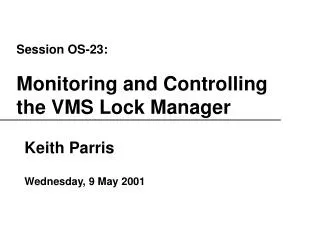
Maumee River near Woodburn WQ Duration Curve (1991 - 2000 Monitoring Data)Site: M-114 High Flows Moist Conditions Mid-range Flows Dry Conditions Low Flows IDEM Data & Gage 04183000 Duration Interval 2,050 square miles