Download
1 / 58
600 likes | 765 Views
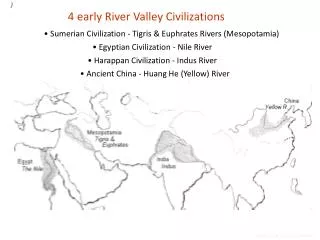
Optimizing ag water resource use in the Tigris-Euphrates Basin: Drought Adaptation Strategies. Frank A. Ward (NMSU) Dina Salman (NMSU) Saud A. Amer (USGS) Erbil, Iraq Summer 2013. Objectives. Learn and apply principle of optimization as framework for improved ag water use decisions.

E N D
Optimizing ag water resource use in the Tigris-Euphrates Basin: Drought Adaptation Strategies • Frank A. Ward (NMSU) • Dina Salman (NMSU) • Saud A. Amer (USGS) • Erbil, Iraq • Summer 2013
Objectives • Learn and apply principle of optimization as framework for improved ag water use decisions. • Learn the basic structure of the General Algebraic Modeling System (GAMS) software package, to be provided by the instructors. • Discover what we mean by the economic value of water in agriculture. • Learn how to put to better use for decision-making data on crops, water, and economics.
Objectives (cont) • Learn how to build, use, and interpret optimization models written in GAMS to improve the performance of water use in crop irrigation for local, provincial, and national needs. • Discover how optimization models can inform better capacity to adapt to water shortages in the lower Tigris-Euphrates Basin. • (Bridge) Show how to use results so that: • farmers can increase income and improve livelihoods. • You can measure economic impacts of water shortage sharing methods.
Road Map • Iraq drought adaptation challenges • Economic Value of Water • Introduction to Optimization • A simple example • GAMS software • 6 Optimization Models in GAMS • Data needs • Math used • Results and Interpretation • Conclusions
Iraq National Development plan (2010)Water Resources Management Sectionhttp://www.iauiraq.org/documents/1159/ndp24th.pdf
5.11.2 Water PoliciesIntegrated Management • Applying principles of integrated management of water resources in coordination with all stakeholders, …p 74.
Water Policies, continuedWise Use • … Make available information so that water users are aware of the importance of the wise use of water … p. 74
Water Policies conservation, drought, and salinity tolerance 9. … expanding application of modern irrigation methods and encourage planting substitute crops that consume less water and resist salinity and drought. P.74
Water PoliciesClimate impacts and growing scarcity 13. Study climate change, and its effects on water supplies into Iraq, and the future living conditions in light of expected scarcity, p. 74.
Water PoliciesResearch on increased water use efficiency … increase the standard of irrigation; reduce waste; … apply research results to new projects, make information available to water users. Establish research centers…p 74
Water PoliciesPricing water to avoid waste and sustain supplies for future generations 15. … setting a suitable price for water to maintain its wealth… p 75
Economic Value of Water in Ag • Information on water’s economic value enables informed choices on water • development • conservation • allocation • purification • protection • when growing demands for all uses occur with • increased scarcity • climate variability
Background • Conceptually correct and empirically accurate estimates of the economic value of water are essential for rational allocation of scarce water across • locations • uses • quality levels • quantity levels • time periods • Is economic rationality a good thing?
Economic Value of Water in Irrigation • The economic value of water in agriculture is defined as what a rational irrigator is willing to pay. How large a check the farmer is willing to write. • Assumes that you want to use water to increase its total economic benefits in agriculture. • Irrigation policy debates typically focus on proposed marginal changes to existing supplies, quantities, or rules for sharing shortages.
Useful examples: value of water • The economic value of protecting a country’s water from under- deliveries by an upstream country is what the country’s water users are willing to pay for the greater reliability of water supply. • The economic value of protecting a region’s irrigated agriculture is the gain in farm income and reduced food pricesthat the protection produces. • The economic value of changing the current system for sharing water shortages when drought occurs is the gain in farm income and reduced food prices made possible by the new shortage sharing system.
Which policies need information on economic value of water? • Value of added water infrastructure • building • Restoring • Value of changing water institutions • Redrafting water laws • Stream adjudications (NM) • Shortage sharing rules (Iraq) • Value of changing water regulations • Groundwater pumping limits • Requiring meters
Economic Value of Water • It’s the willingness to pay for making a change in the status quo of water • Changes in quantity • Changes in quality • Changes in timing • Changes in location • It’s about valuing changes in one of those four dimensions of water use. • Usually requires an economic model grounded in a physical reality
Economic value of diverting irrigation water at a lower v higher point in watershed (e.g., Iraq) • The willingness to pay for altering the diversion point from an upstream to a downstream region. • Farm income gain can be high • Gain in food security can be high • But existing rules may prevent the change • So there can be an economic value in changing the rules for sharing shortages.
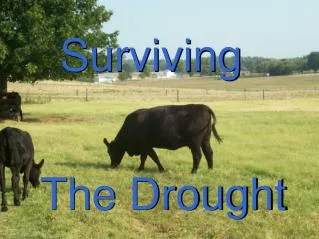
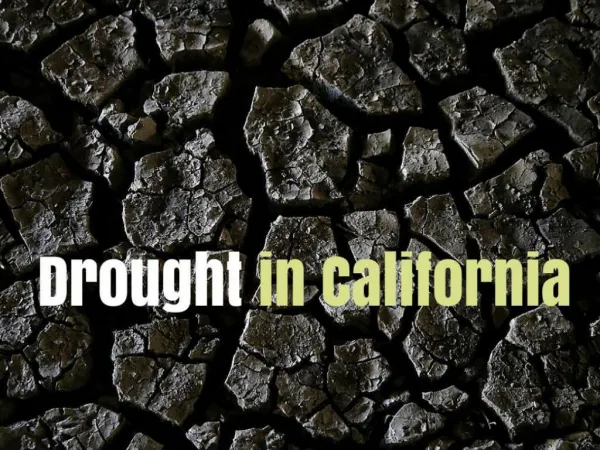
Background: Some Ag Water Challenges • Afghanistan: Identify efficient timing, sizing, and sequencing of water storage projects (especially new storage reservoirs) • Iraq: Identify agricultural water sharing systems for minimizing costs of adapting to drought in Lower Tigris-Euphrates • USA: Protecting Farm Income when droughts occur • Egypt: Identify improvements in water management that increase the Nile’s economic productivity. • Uzbekistan, Tajikistan: Identify Welfare Improving Developments and Allocations of Water in the Basin • Australia: protecting key ecological assets without losing farm land.
Data • Cropping Patterns (land in production by crop and year) • Rice, wheat, cotton, sunflower, Maize, Barley, summer vegetables, winter vegetables, and other crops • Ag Water Use (Lower Tigris-Euphrates) • Meteorological • Temperature, wind, humidity, sunshine • Economic • Prices • Yields • Costs • Water use (ET) • Net Revenue per Ha
Q: What are we doing to do with this data to find out how to raise the economic value of water for irrigation in Iraq when drought occurs?Goal: Reduce economic losses
Optimization • An optimization problem consists of maximizing or minimizing an objective by systematically choosing input values from an allowed set of choices. Result of optimization: • Best choices. • Results of best choices (value of objective). • There are many optimization software packages, we use GAMS (General Algebraic Modeling System).
Maximize Farm Income, by finding the best amount of land assigned to each crop in each province (Lik) subject to a constraint of limited water
Challenge: Use previous slide’s data to optimize total farm income • Goal: Allocate land among crops that optimizes (maximizes) farm income • Method: • Experiment with 3 possible land allocations • For larger problems, GAMS software tries all possible land allocations, then picks the best (optimum) • Data source: 1 Iraqi province (Mousil)
Try 3 combinations of land planted to 2 crops, while using available water: 572 million m3
Do all 3 of these crop land allocations exactly use up total water we have?
For these 2 crops and 572 million m3 of water, do you see other land allocations that use up all the water supply? • How many allocations of land to those 2 crops would exhaust 572 million m3 water? • Answer ________? • Challenge: We want the best allocation of land among crops • Key word: __________
Q: What is Best Use of Land for Maximizing Total Farm Income? Land in production by Crop (1000 ha): • Cotton = 31.78, Wheat = 0 Water Use by Crop (million m3): • Cotton = 572, Wheat = 0 Income by Crop ($ 1000 US): • Cotton = $US 25,928, Wheat = 0 Total Income: = $25,928 (in 1000s)
Can you help the farmer make more income with information on the data slide. They have no computers, and need advice. Exercise: Free cup of tea for anybody who can make more than $25,928 (in 1000s) with available river water. 5-10 minute exercise.
Let’s think about the economic value of water in agriculture • xx
Let’s think about more crops and more provinces There are more than 2 crops and more than 1 province
Simple v Complex Models • Simple Model • 2 crops • 1 province • 1 water supply scenario • More Complex Models • Several crops • Several provinces • Several water supply possibilities • Several possible rules for sharing shortages among provinces
Basin Inflows Used • Ag Water Use from Tigris + Euphrates • Equal to total observed water use in irrigated agriculture from a base year (2006) • Iraq Data from Saud Amer, January 2012
GAMS Structure SETS (crops, provinces, water supply scenarios, shortage sharing rules, … time, use) DATA (prices, costs, yields, water supply) VARIABLES (water use, land use, farm income) EQUATIONS (objective functions and constraints) SOLVER (LP and NLP) Optimization Software • We use GAMS (General Algebraic Modeling System) to model optimization of farm land/water use
GAMS • Development sponsored by World Bank in 1970s • Went private in 1980s • More, faster, and better solvers (1980s – today) • Why GAMS is useful: Expandability • Toy sized models expand to real world application (models 1 – 6) • Suited for river basin optimization • Model structure easy to formulate • When more detail needed, add: crops, reservoirs, tributaries, seasons, years, water uses
Policy Assessment Framework Proposed Actions Data Outcomes Process Hydrology: 3 Water supply scenarios Economics: prices costs Agronomic: yields ET 4 water sharing systems Maximize total farm income for TE basin in Iraq Crop ET Land in production farm income Shadow price = economic value of + 1 unit of water
Course Plan: Mission - Find a water allocation that maximizes farm income with available water supplies • We plan to cover 6 models in the days ahead. All are stimulating and interesting. • All optimize water use in irrigated agriculture. • All use information on the economic value of water in irrigated agriculture. • We’ll have many class exercises • All models and results are based on Iraqi data secured by Dr. Saud Amer in 2012 • Discuss needed model improvements, future classes
Model 1 (done)You allocate land among 2 crops • 2 crops: Wheat and Cotton • 1 province: Mousil • 1 Water constraint: 572 million m3 • 572 million m3 = observed use summed over those crops for that province. • Goal: find the allocation of water among crops that maximizes total farm income.
Model 2You allocate wateramong crops and provinces • 2 provinces: Mousil and Basra. • 2 Crops: Wheat and Cotton. • Water supply: 800.31 Million m3. • Goal: Maximize total farm income
Model 3You assess economic impact of drought on irrigation • 2 provinces: Mousil and Basra. • 2 Crops: Wheat and Cotton. • 2 Water Supplies: Normal (~800) v Dry (~400) • Constraint: historical upper bound on land in production by crop and province • Goal: Maximize Total Farm Income