Download
1 / 48
540 likes | 738 Views
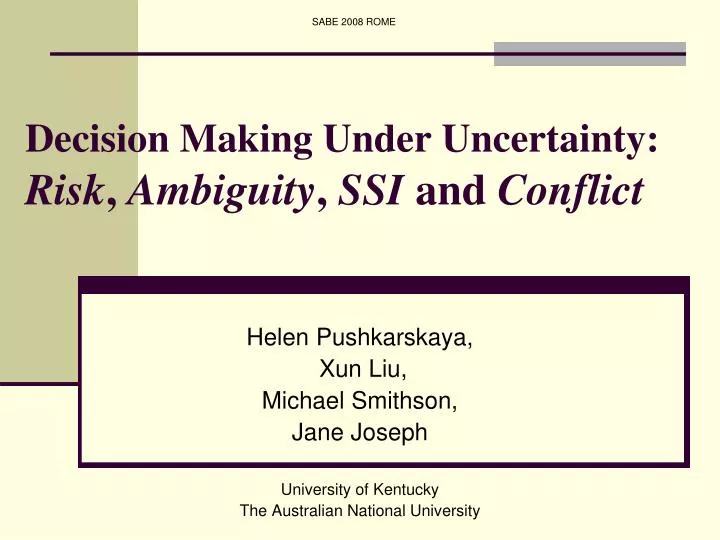
Decision Making Under Uncertainty: Risk , Ambiguity , SSI and Conflict. Helen Pushkarskaya, Xun Liu, Michael Smithson, Jane Joseph University of Kentucky The Australian National University. Plan of the presentation.

E N D
Decision Making Under Uncertainty:Risk, Ambiguity, SSI and Conflict Helen Pushkarskaya, Xun Liu, Michael Smithson, Jane Joseph University of Kentucky The Australian National University SABE 2008 ROME
Plan of the presentation • Background: different types of uncertainty, SEU framework and prior experimental evidence • Research question • Methodology and experimental design • Testable hypotheses • Results • Discussion/ Conclusions SABE 2008 ROME
Background: Uncertainty • Knight, 1921 “Risk, Uncertainty and Profit” • “quantifiable uncertainty” • “unquantifiable uncertainty” SABE 2008 ROME
Uncertainty: Known outcomes • Risk (von Neumann & Morgenstern, 1944) : • probabilities – known • Ambiguity, “when there are questions of reliability and relevance of information, and particularly where there is conflicting opinions and evidence” about probabilities (Ellsberg, 1961, p. 659): • probabilities – unknown/vague SABE 2008 ROME
Uncertainty: Known outcomes • Conflict (Smithson,1999): • equally reliable sources provide conflicting information about probabilities associated with known outcomes SABE 2008 ROME
Uncertainty: Unknown outcomes • Unawareness (Modica & Rustichini, 1994): • decision makers are unaware that some unknown outcomes are possible • Sample Space Ignorance (SSI) (Smithson, 1996; Smithson, Bartos, & Takemura, 2000): • i.e., decision makers are aware that some unknown outcomes are possible SABE 2008 ROME
Subjective Expected Utility • SEU (Savage, 1954): • Risk: choose a prospect with the highest expected value (von Neumann and Morgenstern, 1944). • Ambiguity: ignorance prior –average probabilities over the range of possible values, then treat as risk SABE 2008 ROME
Subjective Expected Utility • SEU (Savage, 1954): • Conflict: ignorance prior--weight estimates of probability of the events from each source equally, then treat as risk • SSI: form a subjective partition of the sample space, follow the ignorance prior idea and assign subjective probabilities to each event from the subjective partition, then treat as risk (An “everything else” outcome is included in the partition and is treated the same way as others.) SABE 2008 ROME
Subjective Expected Utility SEU reduces all types of uncertainty (ambiguity, conflict, and SSI) to risk environment. SABE 2008 ROME
Experimental evidence: Risk • risk-aversion/seeking : individuals vary in their risk attitudes (Dohmen et al., 2005) • risk-aversion/seeking: individuals are more likely to demonstrate risk aversion in the domain of gains and risk seeking in the domain of losses (Tversky & Kahneman, 1992). SABE 2008 ROME
Experimental evidence: Ambiguity • ambiguity aversion: exists, especially in the gain domain (Camerer &Weber, 1992; Lauriola & Levin, 2001). • ambiguity aversion: in the loss domain usually decreases (e.g. Cohen et al., 1987; Viscusi & Chesson, 1999), but still present. SABE 2008 ROME
Experimental evidence: Conflict and SSI • conflict aversion: conflicting unambiguous messages from two equally believable sources are less preferred then two informatively equivalent, ambiguous, but agreeing messages from the same sources (Smithson, 1999; Cabantous, 2006) • conflict aversion: conflicting unambiguous sources are perceived as less credible than ambiguous but agreeing sources. (Smithson, 1999; Cabantous, 2006) • ignorance aversion: individuals prefer risk or ambiguity to SSI (Smithson, 1996; Smithson et al., 2000). SABE 2008 ROME
Research question • Do preferences toward different types of uncertainty (Ambiguity, Conflict, SSI) correlate? • Correlated? – Possibly have similar psychological bases, i.e. recognition of computational limitations (Huettel et. al., 2006) • Or not correlated? – Possibly have distinct psychological bases. SABE 2008 ROME
Methodology and experimental design • Simple gambles that model four uncertain environments: Risk, Ambiguity, Sample Space Ignorance and Conflict. • Within-subjects analysis of three types of data: • behavioral parameters -- (dis)preferences toward Ambiguity, Conflict and SSI • personality and attitude scales • response time SABE 2008 ROME
Method: subjects and tasks • 42 subjects (21 female and 21 males) were given four series of gambles (8 min each) with every series constructed from all four types of gambles mixed in random order (32 gambles from each condition total). • Subjects had to choose between certainty payoff and a three-card gamble, one card of known type and known quantity, and two other cards forming risky, ambiguous, conflicting or ignorance gambles (see Figures a-d). • All four kinds of gambles were matched on the variance of the probabilities as well as on expected payoffs. • 38 (19 males and 19 females) subjects agreed to complete surveys with personality and attitudes scales. SABE 2008 ROME
a) Risk b) Ambiguity c) Conflict d) Sample Space Ignorance SABE 2008 ROME
Method: behavioral parameters Follow Congdon (2003): • Sure payoff – • Card 2 or 3 - • Card 1 - • Where for ambiguity k=1, for conflict k=2, for SSI k=3, and for risk k=4. Note that SABE 2008 ROME
Method: behavioral parameters • g1 -- subjects' preferences for ambiguity • g2-- subjects' preferences for conflict • g3 – subjects’ preference for SSI • g1 (g2, g3)> 1 implies pessimism because it deflates the probabilities, whereas g1 (g2, g3)< 1 implies optimism. SABE 2008 ROME
Method: behavioral parameters • li- the sensitivity of choice probability to the utility difference, or the amount of “randomness” in the participant’s choices • l = 0 means choices are random; as l increases the choices are less random. SABE 2008 ROME
Method: behavioral parameters • qi-- a curvature of the subjects’ utility functions. • q = 1 - the monetary utility function is linear, q < 1 - the monetary utility function is concave (discounting larger values) q > 1- the monetary utility function is convex (inflating larger values). • Pratt (1964) suggested that q describes individual risk-attitudes. Rabin (2000) argued that diminishing marginal utility of wealth (i.e. concavity) cannot explain risk aversion. We treat q as individual (in)sensitivity to monetary rewards. SABE 2008 ROME
Method: behavioral parameters SABE 2008 ROME
Method: behavioral parameters • For 36 out of 42 subjects ,confirms that utility functions are concave • Values of are considerably dispersed, but all of them greater than 0 – choices are not random. • In both Ambiguity and Ignorance conditions probabilities are weighted optimistically ( ), while under Conflict probabilities are weighted pessimistically ( ). SABE 2008 ROME
Method: Personality/attitudes measures • Ten Item Personality Inventory (TIPI, Gosling, S.D., Rentfrow, P.J., & Swann, W.B. Jr., 2003), Big-5 : Openness, conscientiousness, extraversion, neuroticism and agreeableness. • Weber, Blais, and Betz’s (2002) domain-specific risk inventory (DSRI), which elicits self-reported tendencies to take risks in six domains: Recreation, social, ethical, health, gambling and investment. • Need for Certainty (NFCrt) and Need for Discovery (NFD), (Schuurmans-Stekhoven and Smithson, 2008), measuring a desire to bolster current beliefs and a desire for novel information, respectively. • Functional and dysfunctional impulsivity (Dickman, 1990). FI people tend to engage in rapid, error-prone processing, more accurate under time-pressure (Dickman,1990), FI is a significant predictor of increased responding to rewards (Smillie and Jackson, 2003). SABE 2008 ROME
Method: Personality/attitudes measures • The reliabilities for the attitude scales ranged from .60 (dysfunctional impulsivity and total risk-taking) to .91 (need for certainty). • Reliabilities were not computed for the TIPI scales because they consist of only two items each. • Excluded: The gambling risk-taking (insufficient variability in scores); extraversion and conscientiousness (not normally distributed in our sample). SABE 2008 ROME
Method: Response time • Computed average response time (RT) for each subject for each condition • Compared RT across conditions • Correlated RT with behavioral parameters SABE 2008 ROME
Testable hypothesis • H0: (Dis)preferences toward different types of uncertainty have common psychological bases: • H01. Behavioral parameters are correlated • H02. Behavioral parameters correlate with the same personality and attitude measures • H03. Behavioral parameters correlate with corresponding response time in the same manner. SABE 2008 ROME
H01: Correlation among behavioral measures SABE 2008 ROME
H01: Correlation among behavioral measures • g1 and g3 were highly correlated (.85), which suggested a common psychological base for ignorance and ambiguity aversion/seeking • g2 was not correlated with either g1 or g3, which suggested a distinct psychological base for conflict aversion SABE 2008 ROME
H02: Correlation between behavioral parameters and personality/attitudes measures • We predicted ln(g1) + ln(g3) as a composite variable because both parameters have skewed distributions and are strongly positively correlated. This composite variable is predicted (negatively) only by social risk-taking (a=-.108, adjusted R2 = .134, p = .016). • Potentially this might suggest that social risk-taking scale relates not to a specific domain of risk, but to different types of uncertainty (environments with missing information) SABE 2008 ROME
H02: Correlation between behavioral parameters and personality/attitudes measures • g2 has two predictors: Openness and Need for Discovery (adjusted R2 = .244, p = .004). • Oddly, in the regression model Need for Discovery is a positive (a=.071, p = .012) predictor and Openness is a negative (a=-.30, p = .001) predictor, despite the fact that Openness and Need for Discovery are positively correlated (r = .508). SABE 2008 ROME
H02: Correlation between behavioral parameters and personality/attitudes measures • Overall, the behavioral parameters in the choice model are not strongly predicted by the personality and attitude scales. These findings underscore the potential importance of ascertaining the relationship between the behavioral parameters and the attitude/personality scales. SABE 2008 ROME
H03: Correlation between RT and behavioral parameters • RT in different conditions were positively correlated, with exception of ambiguity SABE 2008 ROME
H03: Correlation between RT and behavioral parameters • g1 (.41*) and g3 (.437**) positively correlated with RT under ambiguity. • g2(-.332*)negatively correlated with RT under conflict, and under sure gain (-.335*). • g3 (-.10) did not correlated with RT under SSI. SABE 2008 ROME
Summary of results • Correlation across parameters • g1 and g3 are highly correlated (on average <1) • g2 is not correlated with g1 or g3 (on average >1) • Correlation with behavioral and attitude scales • ln(g1) + ln(g3) was predicted by social risk-taking • g2 has two predictors: Openness (negative) and Need for Discovery (positive) • Correlation with response time • g1 correlated positively with RT under ambiguity • g2 correlated negatively with RT under conflict • g3 was not correlated with RT under ignorance SABE 2008 ROME
Conclusions • (dis)preference toward conflict seems to be significantly different from (dis)preferences toward ambiguity and sample space ignorance • (dis)preferences toward ambiguity and sample space ignorance seem to have at least some common components since g1 and g3 are strongly correlated. However, results of the analysis of RTs suggest existence of distinct psychological contributors. SABE 2008 ROME
Conclusion • Recognition of computational limitations cannot be the common base for attitudes toward ambiguity, sample space ignorance and conflict. • While the literature is clear in understanding of importance of ambiguity in decision making, this study strongly suggests that sample space ignorance and conflict play distinctive roles that have yet to be well understood. SABE 2008 ROME
THANK YOU! • QUESTIONS? SABE 2008 ROME
Appendices • A1. Economic significance of correlations between behavioral parameters and psychological /attitudes measures • A2. Methodology/Study Design • A3. Correlations of q and l with each other, psychological/attitudes measures, RT SABE 2008 ROME
A1. Economic significance of correlations with personality measures SABE 2008 ROME
A1. Economic significance of correlations with personality measures SABE 2008 ROME
A2. Method: statistical model • Where • - describes a bias toward or away from the jth alternative, not determined by money or probability • - sensitivity parameter (l=0 – random choices) • - the ith person monetary parameter (<1 – convex, >1 – concave) • - the probability of the jth alternative payoff • - the ith person probability weighting parameter for the jth alternative (>1 – pessimistic about the probabilities, <1 optimistic about the probabilities) SABE 2008 ROME
A2. Method: Parameterization of subjective monetary and probabilistic judgment of alternatives SABE 2008 ROME
A2. Method: statistical model SABE 2008 ROME
Observed probabilities Predicted probabilities (Chi square (80)=272.13, p<.0001) A2. Method: Statistical model fit SABE 2008 ROME
A2. Method: Card distributions SABE 2008 ROME
A3. q and l. H01: Correlation among behavioral measures • q and l estimates have a strong negative correlation of -.84, suggesting that those with low q values compensated by being more sensitive to other properties of the alternatives when comparing them. SABE 2008 ROME
A3. q and l.H02: Correlation with personality/attitudes measures • Functional impulsivity alone predicts q and l, the monetary utility and sensitivity parameters (for both parameters, adjusted R2 = 091, p = .041). This scale is correlated -.342 and .342 with q and l respectively. • Functional impulsive people might be more sensitive to non-monetary differences between alternatives (use heuristics ?????) SABE 2008 ROME
A3. q and l. H03: Correlation with RT. • l (-.599**) negatively andq(.568**) positively correlated with RT under sure gain • Individuals more sensitive to non-monetary differences among alternative choose “not to bet” more quickly SABE 2008 ROME