Download
1 / 44
440 likes | 534 Views
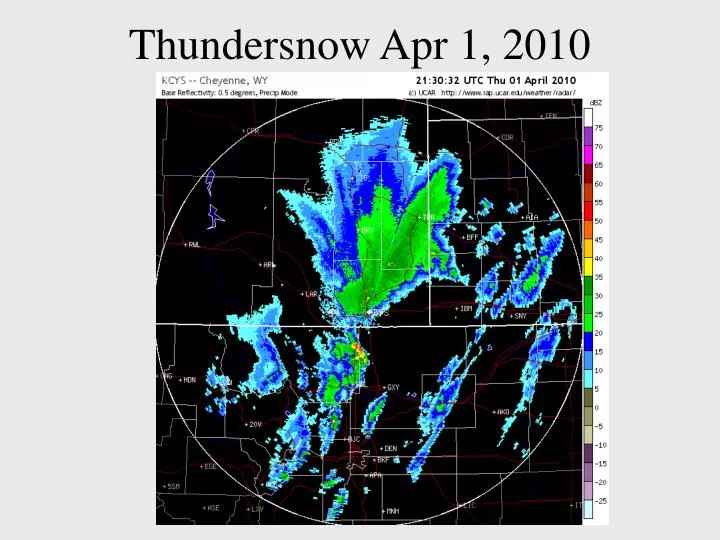
Thundersnow Apr 1, 2010. ATS 351 Lecture 10. Winds, Fronts, and Cyclogenesis. Outline . Atmospheric pressure Forces that affect the wind PGF, Coriolis, Centripetal, Friction Vertical Motion Fronts Mid-Latitude Cyclogenesis. Atmospheric Pressure. Ideal Gas Law p = RT

E N D
ATS 351 Lecture 10 Winds, Fronts, and Cyclogenesis
Outline Atmospheric pressure Forces that affect the wind PGF, Coriolis, Centripetal, Friction Vertical Motion Fronts Mid-Latitude Cyclogenesis
Atmospheric Pressure Ideal Gas Law p = RT p: pressure; : density; R: constant (287 J/kg/K); T: temperature It takes a shorter column of dense, cold air to exert the same pressure as a taller column of less dense, warm air Warm air aloft is normally associated with high atmospheric pressure and cold air aloft with low atmospheric pressure At a given level, more molecules exist above warm air than cold air = higher pressure
Surface and Upper-Level Charts Sea-level pressure chart: constant height Upper level or isobaric chart: constant pressure surface (i.e. 500mb) High heights correspond to higher than normal pressures at any given latitude and vice versa
Cold air aloft: low heights or low pressure Warm air aloft: high heights or high pressures Ridge: where isobars bulge northward Trough: where isobars bulge southward
In Northern Hemisphere: High pressure: anticyclone (winds blow clockwise and outward from center) Low pressure: mid-latitude cyclone (winds blow counter clockwise and inward towards center)
Newton’s 2nd Law of Motion 2nd Law: F = ma F: net force; m: mass of object; a: acceleration At a constant mass, the force acting on the object is directly related to the acceleration that is produced. The object accelerates in the direction of the net force acting on it Therefore, to identify which way the wind will blow, we must identify all the forces that affect the movement of air
Forces that Affect Wind Pressure gradient force (PGF) Coriolis force Centripetal force Friction
Pressure Gradient Force Pressure gradient = ∆p/d ∆p: difference in pressure d: distance PGF has direction & magnitude Direction: directed from high to low pressure at right angles to isobars Magnitude: directly related to pressure gradient Tight lines (strong PGF) stronger wind PGF is the force that causes the wind to blow
Coriolis Force Apparent deflection due to rotation of the Earth Right in northern hemisphere and left in southern hemisphere Stronger wind = greater deflection No Coriolis effect at the equator greatest at poles. Only influence direction, not speed Only has significant impact over long distances Coriolis = 2vΩsin
Geostrophic Winds When the force of PGF and Coriolis are balanced Travel parallel to isobars at a constant speed An approximation since isobars are rarely straight in real atmosphere but close enough to understand winds aloft Spacing of isobars indicates speed Close = fast, spread out = slow
Gradient Winds & Centripetal Force Gradient wind parallel to curved isobars above the level of frictional influence (winds aloft) An object accelerates when it is changing speed and/or direction. Therefore, gradient wind blowing around a low pressure center is constantly accelerating Centripetal acceleration: directed at right angles to the wind, inward toward center of low Centripetal force: inward-directed force Results from an imbalance between the Coriolis force and the PGF
Cyclonic flow: PGF > CF Anticyclonic flow: PGF < CF
Zonal & Meridional Winds Zonal winds: oriented in the W-E direction (parallel to latitude) Moves clouds, storms, surface anticyclones rapidly from west to east Meridional winds: oriented in a N-S trajectory Surface storms move slowly and often intensify major storm systems
Surface and Upper-Level Winds Winds on Upper-level Charts Winds parallel to contour lines and flow west to east Heights decrease from north to south Surface Winds Winds normally cross isobars and blow more slowly than winds aloft Friction: reduces the wind speed which in turn decreases the Coriolis effect Friction layer: surface to about 1000m (3300ft) Winds cross the isobars at about 30° into low pressure and out of high pressure
PGF at surface is balanced by the sum of friction and Coriolis force Surface winds into low and outward from high
Winds & Vertical Motions Since surface winds blow into the center of a low, they are converging and that air has to go somewhere slowly rises Vice versa for winds blowing outward from H Therefore, a surface low has convergence at surface and divergence aloft and a surface high has the opposite.
Hydrostatic Balance There is always a strong PGF directed upward Gravity balances the upward PGF When they are equal, hydrostatic equilibrium exists Good approximation for atmosphere with slow vertical movements Is not valid for violent thunderstorms and tornadoes.
Air Masses of North America Continental Polar (cP) & Arctic (cA) Cold, dry, stable air in winter In summer, cP air mass usually brings relief from oppressive heat in central and eastern US Maritime Polar (mP) In winter, cP/cA air mass is carried over Pacific Ocean where moisture and warmth is added mP at Pacific Coast is cool, moist, and conditionally unstable East of Rockies - brings fair weather and cooler temperatures (moisture has been removed by mountains) East coast mP air mass: originates in N. Atlantic Storms may develop (heavy rain or snow, coastal flooding) Late winter, early spring
Air Masses and Fronts A front is a transition zone between two air masses of different densities Fronts extend both horizontally and vertically
Cold Front Cold, dry stable polar air (cP) is replacing warm, moist, conditionally unstable subtropical air (mT) Steep vertical boundary due to surface friction slowing down the surface front Has strong vertical ascent along the surface front Strong upper level westerlies push ice crystals far ahead of the front, creating Ci and Cs in advance of the front. • Cold, dense air wedges under warm air, forcing the warm air upward, producing cumuliform clouds • Can cause strong convection, severe weather, and squall lines. • Air cools quickly behind the front
Cold Front Rising motion causes decreased surface pressure ahead of the front On a surface pressure map, frontal location can be seen by “kinks” in the isobars, changes in wind direction from a southwesterly to a northwesterly wind, and decreases in temperature. Pressure is lowest at the surface front. On weather maps, cold fronts are indicated by blue lines with triangles pointing in the direction of frontal motion (towards warmer air)
Cold Front Before While After Winds S-SW Gusty, shifting W-NW Temperature Warm Sudden drop Steady drop Pressure Steady fall Min, then sharp rise Steady rise Clouds Increasing, Ci, Cs, Cb Cb Cu Precipitation Brief showers Heavy rains, severe weather Showers, then clearing Visibility Fair to poor Poor Good Dew Point High, remains steady Sharp drop lowering
Warm Front Occurs at the leading edge of an advancing warm, moist, subtropical air mass (mT) from the Gulf replacing a retreating cold, maritime, polar air mass from the North Atlantic (mP) Slowly advances as cold air recedes; moves at about half the speed of an average cold front Speed may increase due to daytime mixing Speed may decrease due to nighttime radiational cooling Smaller vertical slope than cold front
Warm Front Warmer, less-dense air rides up and over the colder, more-dense surface air “Overrunning” Produces clouds and precipitation well in advance of the front
Warm Front Before While After Winds S-SE Variable S-SW Temperature Cool-cold Slowly warming Steady rise Warmer, then steady Pressure Falling Leveling off Slight rise, followed by fall Clouds (in order) Ci, Cs, As, Ns, St, fog (Cb in summer) Stratus-type Clearing with scattered Sc Precipitation Light-to-moderate Drizzle or none Usually none Visibility Poor Improving Fair Dew Point Steady rise Steady Rise, then steady
Stationary Front Essentially no movement Surface winds blow parallel to front, but in opposite directions on either side of it Separates two air masses Seen often along mountain ranges when cold air cannot make it over the ridge
Hourly surface observations at Gage, Oklahoma showing the passage of a primary and secondary cold front (left) and at Bowling Green, Kentucky showing the passage of a warm front (right). Source: Wallace and Hobbs, 2006.
Occluded Fronts Cold fronts generally move faster than warm fronts Occlusion occurs when cold front catches up to and overtakes a warm front Occlusions can be warm or cold
Dry Lines Think of a dry line as a moisture boundary Separates warm, humid mT air in the southern Great Plains from warm, dry cT air Drier air behind dry lines lifts the moist air ahead of it, triggering storms along and ahead of it Induces lifting along front Often produces severe thunderstorms in OK & TX Unique to southern great plains of US because of the Rocky mountains and the Gulf of Mexico
A guide to the symbols for weather fronts that may be found on a weather map: #1 cold front #2 warm front #3 stationary front #4 occluded front #5 surface trough #6 squall/shear line #7 dry line #8 tropical wave
Features of a Mid-latitude Cyclone Deep low pressure area with attached cold and warm fronts Often an occlusion forms, the triple point lending to the formation of severe weather Precipitation associated with the cold and warm fronts organizes in typical “comma cloud” structure
Polar Front Theory • Initially, there is a stationary front that acts as the boundary separating cold, continental polar air from warm, maritime tropical air • Winds blow parallel to this front on either side • Polar Fronts are discontinuous
Cyclogenesis Central Pressure • A wave forms on the front due to a shortwave disturbance • Frontal Wave • Incipient Cyclone • The front develops a "kink" where the wave is developing • Precipitation will begin to develop along the front • Overrunning and lifting
Strengthening • The cyclonic circulation around the low becomes more defined • The central pressure intensifies • The cold front and warm front have more organized motion • Cyclone usually pushed east or northeast by the winds aloft
Mature Cyclone • The cold front catches up with the warm front and an occlusion forms • The cyclone is at its strongest at this point • Severe weather often develops near the “triple point”
Dissipation • The occlusion grows with time • Eventually, the occlusion is so great that the supply of warm, moist air into the low is cut off • Cold air on both sides • When this happens, the system starts to dissipate