Download
1 / 10
100 likes | 180 Views
Manual Interpretation of EEGs: A Machine Learning Perspective. Christian Ward, Dr. Iyad Obeid and Dr. Joseph Picone Neural Engineering Data Consortium College of Engineering Temple University Philadelphia, Pennsylvania, USA. Abstract.

E N D
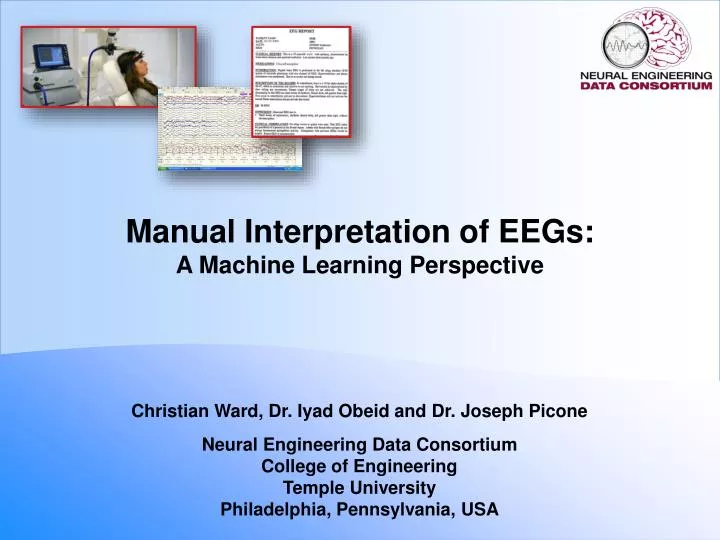
Manual Interpretation of EEGs:A Machine Learning Perspective Christian Ward, Dr. Iyad Obeid and Dr. Joseph Picone Neural Engineering Data Consortium College of EngineeringTemple University Philadelphia, Pennsylvania, USA
Abstract The goal of this presentation is to describe, from a machine learning perspective, how an electroencephalogram (EEG) is manually interpreted. This presentation is not meant to be a comprehensive tutorial on diagnosing illnesses from EEG data. Instead, it attempts to document what physicians look for in the signals, and to describe these in terms that can be translated into signal processing and machine learning code. An extracranial EEG measures brain function indirectly through electrodes placed in an array on the scalp. Events of interest to physicians originate as nerve impulses deep in the brain. By the time these signals reach the scalp they are heavily filtered and spatially dispersed. Interpreting the underlying pathology or determining the diagnosis is an art because (1) the transduced signals at the scalp are very noisy due to their relatively low voltage (microvolts) and (2) the artifacts in the waveform that correlate with a pathology are context dependent (knowledge of the surrounding behavior is important). In this presentation, we review what diseases are diagnosed using EEGs, what artifacts are used to identify these diseases, and what properties of the signal correlate with these artifacts. Both time domain (e.g., waveform shapes) and frequency domain behavior (e.g., fundamental frequency) play an important role in identifying these artifacts.
Manual Interpretation of EEGs • A technician administers a 30−minute recording session. • An EEG specialist (neurologist) interprets the EEG. • An EEG report is generated with the diagnosis. • Patient is billed once the report is coded and signed off.
Signal Transduction • 329 positions are defined as potential electrode locations: • 24 to 36 channels are commonly used; 64 and 128-channel EEGs are used in research • 10/20 configuration (black): yields 19 channels plus several reference channels (typically the ears and forehead) • 10/10 configuration (gray): typically doubles the number of channels • Differential voltages are typically measured between a sensor and an ear (e.g., F3-T9) • Common reference points include the ears (T9 and T10), the nose (e.g., ???) and the heart/respiratory system (e.g., EKG1 and EKG2)
Common Diseases Diagnosed With An EEG • Epilepsy: a neurological disorder marked by sudden recurrent episodes of sensory disturbance, loss of consciousness, or convulsions. • Stroke: a sudden disabling attack or loss of consciousness caused by an interruption in the flow of blood to the brain. • Posterior Reversible Encephalopathy Syndrome (PRES): characterized by headache, confusion, seizures and visual loss. It may occur due to a number of causes, predominantly malignant hypertension, eclampsia and some medical treatments. • Middle Cerebral Artery (MCA) Infarct: obstruction of one of the three major paired arteries that supply blood to the cerebrum. • Other uses of EEGs include diagnosis of Alzheimer's disease, certain psychoses, and sleep disorders (narcolepsy). • The EEG may also be used to determine the overall electrical activity of the brain, which is used to evaluate trauma, drug intoxication, or brain damage. • The EEG may also be used to monitor blood flow in the brain during surgical procedures. • The EEG cannot be used to measure intelligence
Most Significant Primitives • Spike and Wave: … describe… … .. .. .. . . . . . . . …………………. . . . . . . • GPED Triphasic: … describe …. . . . . . . . ... . . . … . . . . . . . . . . . . . . . • PLED: … describe …. . . . . . . .. . . . . . . . . . . . . … . . . . . . . . . . . . • Eye Blink: … describe why …… . . . . . . . . . . . . . . . . ….. . . . . . . . . . • Background: models all other artifactsnot included in the above categories. • Though there are some variations in these signals for infants whose brains are not fully developed, the basic composition of these signals is relatively age and subject invariant.
Summary and Future Work • Summary: • Deep… • For… • NEDC… • Future Work: • Three… • Two…
Brief Bibliography of Relevant Documentation [1] Tatum, W., Husain, A., Benbadis, S., & Kaplan, P. (2007). Handbook of EEG Interpretation. (Kirsch, Ed.) (p. 276). New York City, New York, USA: Demos Medical Publishing. [2] Wulsin, D. F., Gupta, J. R., Mani, R., Blanco, J. A., & Litt, B. (2011). Modeling electroencephalography waveforms with semi-supervised deep belief nets: fast classification and anomaly measurement. Journal of Neural Engineering, 8(3), 36015. [3] Jurcak, V., Tsuzuki, D., & Dan, I. (2007). 10/20, 10/10, and 10/5 systems revisited: Their validity as relative head-surface-based positioning systems. NeuroImage, 34(4), 1600–1611. [4] Claassen, J., Mayer, S. A., Kowalski, R. G., Emerson, R. G., & Hirsch, L. J. (2004). Detection of electrographic seizures with continuous EEG monitoring in critically ill patients. Neurology, 62(10), 1743–1748.