Download
1 / 44
440 likes | 518 Views
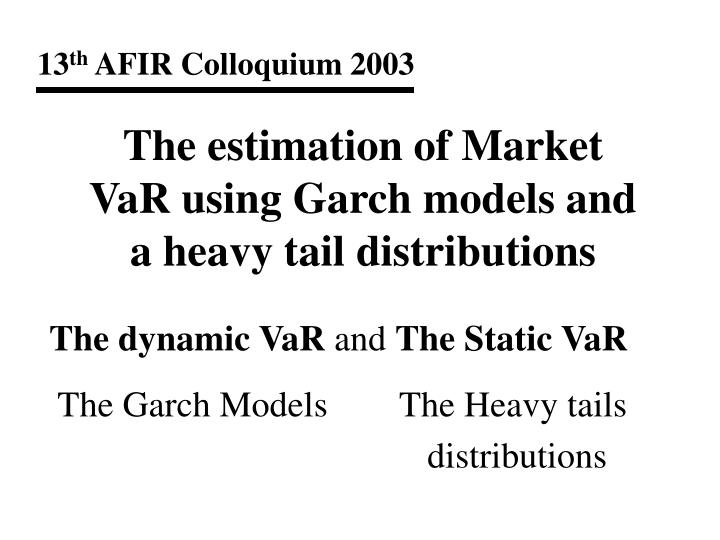
13 th AFIR Colloquium 2003. The estimation of Market VaR using Garch models and a heavy tail distributions. The dynamic VaR and The Static VaR. The Garch Models The Heavy tails distributions. 13 th AFIR Colloquium 2003. The market VaR.

E N D
13th AFIR Colloquium 2003 The estimation of Market VaR using Garch models and a heavy tail distributions The dynamic VaR and The Static VaR The Garch Models The Heavy tails distributions
13th AFIR Colloquium 2003 The market VaR • The principal components • The volatility • The probability distributions of returns • The probability defined for the maximum loss to be accepted
13th AFIR Colloquium 2003 Why we need a credible VaR • Because when we calculate a VaR position we need to make a reserve outside the portfolio 2) Because the traders must believe in this VaR and constraint the portfolio in order to comply with the limits as a result of VaR estimation 3) Because when we make a reserve we reduce the dividends, and add additional costs for this frozen funds
13th AFIR Colloquium 2003 The first component of VaR: The volatility How it is presented the volatility in the market? 1) The volatility don’t follows the law of t0.5 2) The volatility is presented in clusters. There are moments of great volatility followed by moments of tranquility 3) The volatility series is a predictable process
13th AFIR Colloquium 2003 How to forecast the volatility Regress the series returns on a constant and the model is: The constant is the mean of the series and the residuals, et are the volatility or the difference between the value observed and the constant or the mean of the series.
13th AFIR Colloquium 2003 The presence of Arch in the model First step: Test the hypothesis Ho : r1 = r2 = r3 = . . . . = rk = 0 H1 : some rk 0 Use the statistic:
13th AFIR Colloquium 2003 Second step: The Arch LM Test Ho : There are absence of Arch H1 : There are presence of Arch Estimate the following auto regression model: And calculate the Observations * R2 = TR2 This coefficient TR2 c2k
13th AFIR Colloquium 2003 Some results of different series
13th AFIR Colloquium 2003 With the presence of Arch the forecast volatility may be done by nonlinear models 1) Garch models 2) RiskMetrics™ or EWMA 3) Asymmetric Garch models RiskMetrics is a trade mark of J.P.Morgan
13th AFIR Colloquium 2003 The Garch model If the volatility for tomorrow is a result of: “a little of the error of my prediction of today plus a little of the prediction for today” Then we are in presence of a Garch(1,1)
13th AFIR Colloquium 2003 The beauty of Garch (1,1) model The square error of an heteroscedasticity process seems an ARMA (1,1). The autoregressive root that governs the persistence of the shocks of volatility is the sum of (a + b)
13th AFIR Colloquium 2003 Now we can estimate the volatility For the day t For t days or the volatility between t and t+t
13th AFIR Colloquium 2003 Risk Metrics™ The analysts have fruitfully applied the Garch methodology in assets pricing models and in the volatility forecast. Risk Metrics use a special Garch model when use the decay factor l = 0.94. The behavior of this model is similar to: Garch (1,1) with a = (1-l), b = l and w = 0 ™] Risk Metrics is a trade mark of J. P. Morgan
13th AFIR Colloquium 2003 The limitations of Garch (1,1) 1) Garch models only are sensitive to the magnitude of the excess of returns and not to the sign of this excess of return. 2) The non negative constraints on w, a, andb which are imposed to ensure that s2tremains positive 3) The conditional moments, may explode when the process itself is strictly stationary and ergodic.
13th AFIR Colloquium 2003 The solutions for the limitations of Garch (1,1)The asymmetric models Egarch (p,q) Tarch (1,1)
13th AFIR Colloquium 2003 How to detect the asymmetry and select the correct model Log likelihood 1 A.I.C. S.C. 2 The asymmetry test
13th AFIR Colloquium 2003 The cross correlation for the asymmetry test Where:
13th AFIR Colloquium 2003 The asymmetry test We must do a cross correlation between the squared residuals of the Garch model and the standardized residuals of the same (et/st) The result of this cross correlation will be a white noise if the model is symmetric or in other words the Garch model is correctly specified, and a black noise is the model is asymmetric.
13th AFIR Colloquium 2003 The results applied to Tbond 5 y.
13th AFIR Colloquium 2003 The results applied to Tbond 5 y.
13th AFIR Colloquium 2003 The tests to confirm the use of an asymmetry model for Treasury 5 years The cross correlogram Limits to accept a white noise 1 2 3 4 5
13th AFIR Colloquium 2003 The second component of VaRThe probability distribution It was demonstrated that the returns don’t follows a normal distribution, for that reason I include the Heavy tails distributions What probability distribution follows the returns?
13th AFIR Colloquium 2003 The heavy tails distributions found in returns series The Logistic Distribution
13th AFIR Colloquium 2003 The heavy tails distributions found in returns series The Weibull Distribution
13th AFIR Colloquium 2003 e = 0 Gumbel Distribution e < 0 Frechet Distribution e > 0 Weibull Distribution The EVD This distribution depends of three parameters: m = mode; y = location and e = shape Where z = (y – m) / y
13th AFIR Colloquium 2003 The PWM for estimate EVD parameters Where U is a plotting position that follows a free distribution and k takes the probability as: pk,n = [(n-k)+0.5]/n.
13th AFIR Colloquium 2003 The EVD e>0 Weibull distribution with different values of e e=0.50 e=0.99 e=0.24 e = 0.75 e=0.10
13th AFIR Colloquium 2003 The EVD e<0 Frechet distribution with different values of e e=-0.10 e=-0.9 e=-0.5
13th AFIR Colloquium 2003 The Kupiec solution Kupiec demonstrate that on base a normal distribution that it is possible to extend the tails of the distribution in form that contemplate the probability of a catastrophe. The value that takes the abscissa named z of a standardized normal distribution extended by Kupiec is:
13th AFIR Colloquium 2003 An example of returns: Tbond 5 y. The Goodness of fit test K/S 0.0479 AD 2.4008 Tbond 5y. daily returns
13th AFIR Colloquium 2003 An example of returns: Bovespa The Goodness of fit test K/S 0.0198 AD 0.5067 Bovespa daily returns
13th AFIR Colloquium 2003 The Goodness of fit tests 1) Kolmogorov Smirnov The Kolmogorov Smirnov test is a test that is independent of any Gaussian distribution, and have the benefit that not need a great number of observations. There is one critical value that depends on the number of observations and the level of confidence
13th AFIR Colloquium 2003 The Goodness of fit tests 2) Anderson Darling The Anderson Darling test is a refinement of KS test, specially studied for heavy tails distributions. There are several critical values for each distribution fitted and depends from the number of observations and the level of confidence
13th AFIR Colloquium 2003 What type of distributions we found
13th AFIR Colloquium 2003 Simulations • After we define the best probability distribution for the series returns we can simulate 20.000 trials using two methods • Montecarlo • Latin Hypercube • The objective is found the value of the first percentile to determine the worst loss possible
13th AFIR Colloquium 2003 Simulation with daily returns of Tbond 5y
13th AFIR Colloquium 2003 Simulation daily returns D.Jones The Logistic Distribution The EVD Distribution
13th AFIR Colloquium 2003 Some results
13th AFIR Colloquium 2003 The Market VaR of Tbond
13th AFIR Colloquium 2003 The Market VaR of DJI
13th AFIR Colloquium 2003 Conclusions The asymmetric Garch models, like Tarch or Egarch model, not only fulfill with the movements of the volatility, as we can observe with the back testing presented, also it is not necessary to use the heavy tails distributions, because the negative impact or the negative returns are included by the model form and is the form of a dynamic VaR
13th AFIR Colloquium 2003 Conclusions The static VaR estimated with the heavy tails distribution don’t follows the volatility movements and create reserves in excess. The time series history, complies with the requirements of Basel II, to make the volatility forecast. It is easy to teach this model to the traders, but not for the actuaries. The traders and the shareholders only import the recent past