Download
1 / 5
50 likes | 168 Views
Introduction to Curve Fitting: The Line of Best Fit. OBJ: To find the line of best fit for a set of data and find the correlation coefficient for a set of data. This is the key sequence on the calculator: STAT, 1 (for EDIT),1, ENTER, 2, ENTER, 3, ENTER, 4, ENTER, , 2, ENTER,

E N D
Introduction to Curve Fitting: The Line of Best Fit OBJ: To find the line of best fit for a set of data and find the correlation coefficient for a set of data
This is the key sequence on the calculator: STAT, 1 (for EDIT),1, ENTER, 2, ENTER, 3, ENTER, 4, ENTER, , 2, ENTER, 3, ENTER, 5, ENTER, 5, ENTER, STAT, , 4, ENTER. EX: Find an equation of the line of best fit for the data (1, 2), (2, 3), (3, 5), (4, 5).
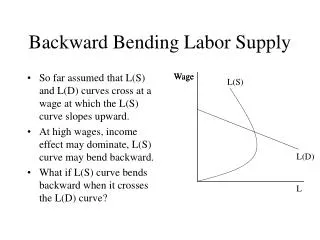
In order to measure how closely points tend to cluster about the line of best fit, statisticians use a correlation coefficient, denoted r. If the data fits perfectly on a line with positive slope, the correlation coefficient is said to be + 1. If the data fits perfectly on a line with negative slope, the correlation coefficient is said to – 1. If the points tend not to lie on any line, then the correlation coefficient is close to 0.
EX: For each pair of variables, tell whether you think the correlation is positive, negative, or approximately zero. Briefly give your reasons. Average daily temperature during January and average heating cost in January. A person’s income and the value of his or her house. The amount of annual taxes a person pays and his or her height. Find the correlation coefficient for the data. This is the key sequence on the calculator: VARS, 5, , , 7, ENTER.
EX: The table shows statistics forfour NHL career scoring leaders. • Find the correlation coefficient. • Find an equation of the line of best fit. • Bobby Hill played 1063 games. Use the equation of the line of the best fit to predict the number of goals he might have scored.