Download
1 / 1
10 likes | 185 Views
Noninvasive Electrocardiographic Imaging of Cardiac Arrhythmias.

E N D
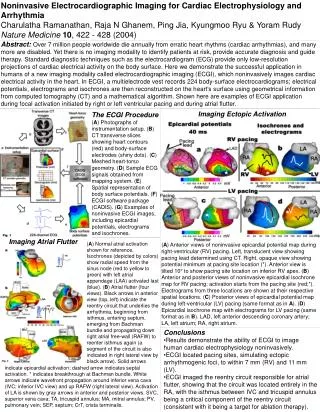
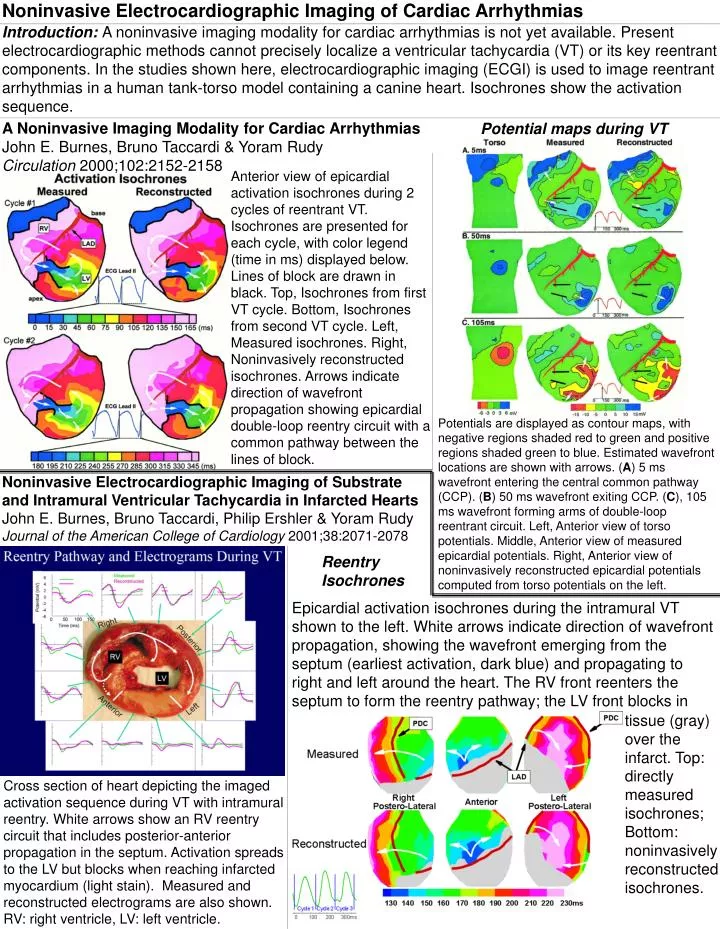
Noninvasive Electrocardiographic Imaging of Cardiac Arrhythmias Introduction: A noninvasive imaging modality for cardiac arrhythmias is not yet available. Present electrocardiographic methods cannot precisely localize a ventricular tachycardia (VT) or its key reentrant components. In the studies shown here, electrocardiographic imaging (ECGI) is used to image reentrant arrhythmias in a human tank-torso model containing a canine heart. Isochrones show the activation sequence. A Noninvasive Imaging Modality for Cardiac Arrhythmias John E. Burnes, Bruno Taccardi & Yoram Rudy Circulation 2000;102:2152-2158 Potential maps during VT Anterior view of epicardial activation isochrones during 2 cycles of reentrant VT. Isochrones are presented for each cycle, with color legend (time in ms) displayed below. Lines of block are drawn in black. Top, Isochrones from first VT cycle. Bottom, Isochrones from second VT cycle. Left, Measured isochrones. Right, Noninvasively reconstructed isochrones. Arrows indicate direction of wavefront propagation showing epicardial double-loop reentry circuit with a common pathway between the lines of block. Potentials are displayed as contour maps, with negative regions shaded red to green and positive regions shaded green to blue. Estimated wavefront locations are shown with arrows. (A) 5 ms wavefront entering the central common pathway (CCP). (B) 50 ms wavefront exiting CCP. (C), 105 ms wavefront forming arms of double-loop reentrant circuit. Left, Anterior view of torso potentials. Middle, Anterior view of measured epicardial potentials. Right, Anterior view of noninvasively reconstructed epicardial potentials computed from torso potentials on the left. Noninvasive Electrocardiographic Imaging of Substrate and Intramural Ventricular Tachycardia in Infarcted Hearts John E. Burnes, Bruno Taccardi, Philip Ershler & Yoram Rudy Journal of the American College of Cardiology 2001;38:2071-2078 Reentry Isochrones Epicardial activation isochrones during the intramural VT shown to the left. White arrows indicate direction of wavefront propagation, showing the wavefront emerging from the septum (earliest activation, dark blue) and propagating to right and left around the heart. The RV front reenters the septum to form the reentry pathway; the LV front blocks in inexcitable tissue (gray) over the infarct. Top: directly measured isochrones; Bottom: noninvasively reconstructed isochrones. Cross section of heart depicting the imaged activation sequence during VT with intramural reentry. White arrows show an RV reentry circuit that includes posterior-anterior propagation in the septum. Activation spreads to the LV but blocks when reaching infarcted myocardium (light stain). Measured and reconstructed electrograms are also shown. RV: right ventricle, LV: left ventricle.