Download
1 / 41
410 likes | 497 Views
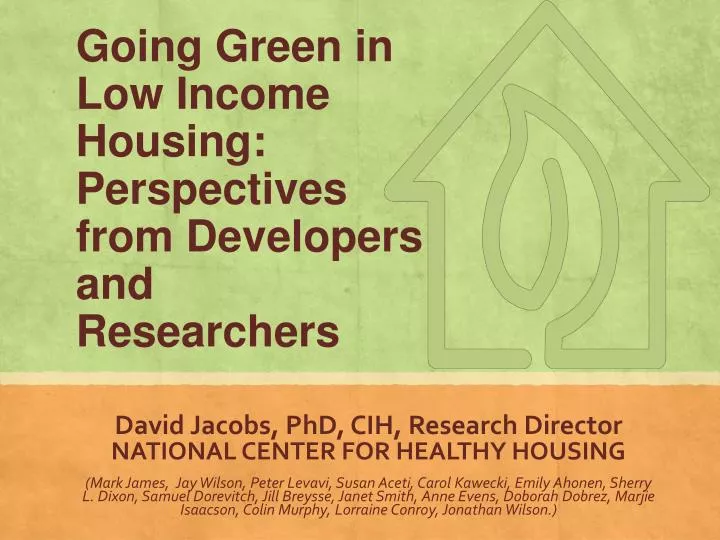
Going Green in Low Income Housing: Perspectives from Developers and Researchers. David Jacobs, PhD, CIH, Research Director National Center for Healthy Housing

E N D
Going Green in Low Income Housing: Perspectives from Developers and Researchers David Jacobs, PhD, CIH, Research Director National Center for Healthy Housing (Mark James, Jay Wilson, Peter Levavi, Susan Aceti, Carol Kawecki, Emily Ahonen, Sherry L. Dixon, Samuel Dorevitch, Jill Breysse, Janet Smith, Anne Evens, DoborahDobrez, Marjie Isaacson, Colin Murphy, Lorraine Conroy, Jonathan Wilson.)
Is Housing a Shared Commons? Is Housing Part of the Infrastructure?
Green Communities Criteria • Integrated Design Process • Location and Neighborhood Fabric • Site • Water Conservation • Energy Conservation • Materials and Resources • Healthy Living Environment • Operations and Management
Health Criteria • ASHRAE 62.2 • Kitchen and bath exhaust ventilation • No carpet in kitchens/baths • Low VOC paints/adhesives • Integrated Pest Management • Radon testing & mitigation • Moisture & mold mitigation • Low/no formaldehyde wood composite products
Results *p<0.05
Adults Increased Decreased • Excellent or very good general health increased from 33% to 62%* • Non-asthma respiratory decreased from 32% to 9%* • Asthma decreased from 17% to 13% *p≤0.05
Moisture *p<0.05
Pests *p<0.05
Contaminants • Year-long average CO2 = 982 ppm • All VOCs below ATSDR minimum risk levels
Energy & Water 46% Reduction in total energy use 39% Estimated reduction in CO2 emissions from power plants
Moving Into Green Healthy Housing: The Yield (Chicago, IL) J Public Health ManagPract. 2014 Jan 7 David E. Jacobs, PhD, CIHa,b Emily Ahonen, PhDaSherry L. Dixon, PhDbSamuel Dorevitch, MDa Jill Breysse, MHS, CIHb Janet Smith, PhD,a Anne Evens, PhD,a,cDoborahDobrez, PhDaMarjie Isaacson, PhDcColin Murphy, MSa Lorraine Conroy, PhD,aPeter Levavid a University of Illinois at Chicago, 2121 W Taylor St., MC 922, Chicago, IL 60612b National Center for Healthy Housing, Columbia, MDc Center for Neighborhood Technology Energy, Chicago, ILdBrinshore Michaels Development, Northbrook, IL
Methods • Compared: • Health status of public housing residents before and after a move from old poor-quality public housing into new green healthy housing • These residents to a control group that did not move
MedicaidData • Adult medicaid expenditures did not vary between time intervals or between study and control groups • At Interval 2, Child medicaid expenditures were marginally significantly higher for the study gp ($1226) than control ($785) (p=0.053) but trend not consistent across other time intervals • Overall conclusion: Some time intervals showed Medicaid savings and other showed costs, but none of the trends reached statistical significance. • Medicaid data were difficult to interpret-trends seen in self-reported health may not have been observable due to “secular trends in program administration, eligibility, and rising cost of medical care in general . . .“
Air Contaminants (24 hour samples, geometric means, n=45 units)
Healthy and Green Rehab Elements • Asbestos Abatement • Improved insulation • Energy Star appliances and fixtures • Energy efficient lighting • Upgraded infrastructure • Door/window repair and replacement • Site improvements to improve walkability • Integrated Pest Management • No carpet in wet areas • New local exhaust fans in kitchens and baths vented to outdoors • Low-VOCs paints and carpet in bedrooms • Non-PVC floor tiles • Waterproofing/damp-proofing • Plumbing repairs • Fire extinguishers in unit
WATTS to Well-BeingChicago, NYC, Boston Compared: • Health status of residents before and after energy upgrades • N= 248 households • Chicago, NYC, Boston • Buildings with one to more than 3 units
Results Improved Worsened • Mean general health score decreased from 3.07 to 2.78* • Improvements in: • Sinusitis (5%)* • Hypertension (14%)* • Overweight (11%)* • Use of asthma medication during asthma attacks (20%) • Days with problems sleeping* • Frequency of symptoms* *p<0.05
MIGHHTY, Highline, DC Green, Watts to Well-Being, and GREAT Studies • These projects were funded by the U.S. Department of Housing and Urban Development, Office of Healthy Homes and Lead Hazard Control. The work that provided the data for part of this presentation was supported by “Recovery Act or American Recovery and Reinvestment Act (ARRA)” funding under an award with the U.S. Department of Housing and Urban Development. The substance and findings of the work are dedicated to the public. The authors are solely responsible for the accuracy of the statements and interpretations contained in this publication. Such interpretations do not necessarily reflect the views of the Government.
Conclusions • Using modern green & healthy housing principles in low-income housing produces substantial self reported health and housing quality benefits • All low-income housing construction and rehab should include green healthy housing requirements
David Jacobs, PhD, CIH, Research Director Djacobs@nchh.org NATIONAL CENTER FOR HEALTHY HOUSING www.nchh.org @nchh Facebook.com/Healthy Housing www.nchh.org/Resources/Blog.aspx