Download
1 / 47
470 likes | 597 Views
Shaping Your Incoming Class and Maximizing New Revenue. OKLAHOMA CITY UNIVERSITY Kevin Windholz, Vice President of Enrollment Management Jacob Dearmon, Associate Professor of Economics. About Us. Kevin Windholz

E N D
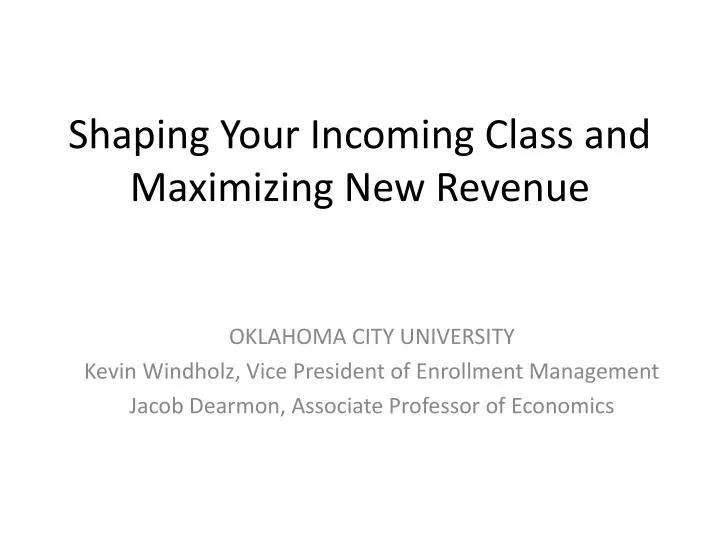
Shaping Your Incoming Class and Maximizing New Revenue OKLAHOMA CITY UNIVERSITY Kevin Windholz, Vice President of Enrollment Management Jacob Dearmon, Associate Professor of Economics
About Us • Kevin Windholz • Vice President of Enrollment Management, Oklahoma City University (2012-present) • Associate Director of Admission Operations, Saint Louis University (2006-2012) • Assistant Director of Admissions, Washburn University (2003-2006) • Admissions Counselor, Washburn University (2001-2003)
About Us • Dr. Jacob Dearmon • Education • Chemical Engineering, B.S. • Economics, Ph.D. • Work • Quorum Business Solutions: • Software Development • OCU: • Associate Professor of Economics, 2012 Faculty Fellow • Devon Energy: • Spatial Modeling and Machine Learning • Economic Research and Policy Institute: • Sales Tax Forecasting for the City of OKC • Energy Policy Analysis
Challenges • Less overall ability to pay • Increase in unpaid balances • Fear of a tuition hike • Significant increase in discount rates to preserve headcount • Less university revenue • Harder to prove our value
Financial Awareness Campaign • Done extensively with fall 2013 incoming students, but started small with fall 2012 incoming • Combination of items new at Oklahoma City University and those brought from Saint Louis University • Involves communication plan in various forms, and constant review of different types of financial data
Financial Aid Communication Plan • Senior Year Plan • Always ‘proudly’ display cost, with detailed financial aid and scholarship info close by • October: • ‘Financing Your Education’ mailer • Personal accounts of financial aid • Financial Aid webinar • Parent newsletter covering full process • Scholarship notices begin • November • FAFSA 4Caster information
Financial Aid Communication Plan • December • File FAFSA Card • January/February • Financial Aid (FAFSA Process) Chats • March • Awards Packets Begin • April • Financial Aid Interviews (with admissions)
Financial Aid Communication Plan • May/June • Explanation of charges at STARS 101 • July • Student Accounts webinar • Statements are mailed
Financial Aid Interviews • Admissions counselors are trained as financial aid counselors • Give every admit the opportunity to have a one on one interview about their financial aid package and potential charges • Benefits to doing this pre-STARS 101 *credit to Mark Steinlage, Associate Director of Freshman Recruitment, Saint Louis University
Award Packets • Converted to paper for all new students • Paper letter and cost calculation sheet • Booklet with full explanation of loans • Glossary of financial aid terms • Instructions on how to accept online • Introduction of OCU email *credit to Cari Wickliffe, Assistant Vice President of Enrollment and Retention Management and Director of Student Financial Services, Saint Louis University
Paper Statements • Once a new student has enrolled, they receive a letter in the email explaining the timeline of when charges will be billed • Statement comes in the form of paper (new students only), with an attachment of how to understand terms and further explanation of payment plans • Instructions on how to pay online are enclosed
Results: Incoming Statistics • Grew headcount by 7% • Raised annual incoming freshman net revenue almost $800,000 • Lowered discount rate by a percentage point • Freshman-Sophomore Retention Rate – 82% • up from 80% year prior
Discount Drop • Modeled the class in house the summer prior, then set firm budgets with discount giving areas • More ‘financial education’ caused less requests for need based aid
DATA, DATA, DATA • Looked at Zip Code Household Buying Power (HBP) for applicants • FAFSA Data for admits • Look at EFC levels • FAFSA positions
Negotiated Amounts Jacob Dearmon
Introduction • Scenario: • An admitted Business student with a 27 ACT who lives 10 miles away has come into your office asking for more aid. • Questions: • Will you give him additional aid? • If so, what amount will you give? • What factors play into your decision?
Introduction • The scholarship negotiation affects two key items: • The probability that an admitted student will enroll. • The net revenue that an admitted student will generate should he/she enroll.
Introduction • As the student’s aid increases, so does the probability of enrollment. Probability Add’l Sch. Amt.
Introduction • Trade-Off: • Give the admitted student too little scholarship, he/she won’t come. • Give the admitted student too much, he/she won’t generate any revenue. • Key Question: • Where is the sweet spot???
Negotiated Amounts • We use data-mining and optimization processes to identify the sweet spot and help inform scholarship allocation decisions. • This process • Is Automated • Uses Historical Data • Is Able to Identify the Student’s Sweet Spot • Is Able to Recommend Scholarship Allocation Across a Pool of Admitted Students Based on the Greatest Return
Negotiated Amounts: Student Level • This process depends on ExpectedNetRevenuewhich consists of two parts: • Probability of enrollment • Net revenue should the admitted student enroll • The next slide shows the relationship between scholarship, enrollment probability and expected net revenue for an individual student.
Negotiated Amounts: Student Level Graphs Prob. Of Enrollment Increasing Exp. Net Rev. Increasing
Negotiated Amounts: Student Level Graphs Prob. Of Enrollment Increasing Exp. Net Rev. Increasing
Negotiated Amounts: Student Level Graphs Prob. Of Enrollment Increasing Exp. Net Rev. Increasing
Negotiated Amounts: Student Level Graphs Prob. Of Enrollment Increasing Exp. Net Rev. Increasing
Negotiated Amounts:Student Level Graphs Prob. Of Enrollment Increasing Exp. Net Rev. Increasing
Negotiated Amounts:Student Level Graphs Prob. Of Enrollment Increasing Exp. Net Rev. Decreasing
Negotiated Amounts:Student Level Graphs Prob. Of Enrollment Increasing Exp. Net Rev. Decreasing
Negotiated Amounts:Student Level Graphs “Sweet Spot”
Student Level Report:Add’l Scholarship Data Current Rec.
Negotiated Amounts: Managerial Concerns • The availability of discounts might be limited. • Given this constraint, how should discounts be allocated across a pool of admitted students? • How does one control for input quality?
Global Scholarship Allocation • Allocate dollars based on some user defined increment up to some maximum amount on a per student basis. • Allocation proceeds based on some user-defined combination of gains in Expected ACT and Expected Net Revenue. • In other words, dollars are allocated based on the “biggest bang for the buck”.
Details: A Closer Look • Expected Net Revenue depends on the probability of enrollment. • How is probability of enrollment determined?
Probability Estimate:Possible Factors • Academic Input Quality- HS GPA, ACT • Financial Aid- Tuition, Fees, Scholarships (Discount and Endowed), Grants, Loans, Remission • Financial Need- EFC • Demographic Characteristics • Location- Distance, Census Data • Preference for OCU • Economic Data • School or College
Probability Estimate: Objective and Considerations • Objective: 1) To determine a robust estimate of the student’s enrollment probability accounting for the student’s characteristics and 2) to capture its sensitivity to changes in the aid amount. • Considerations: • How are the appropriate set of factors determined? • How does one account for the uncertainty regarding the true set of factors? • How is the appropriate relationship between these variables and enrollment determined? • How many methods should be used? • If more than one, how should they be combined? • How should results be assessed?
Conclusion • We have extended, or are in the process of extending, this program to other areas as well including: • Setting the Tuition Amount • Setting the Scholarship Matrix Amounts • Assessing Retention Outcomes