Download
1 / 1

E N D
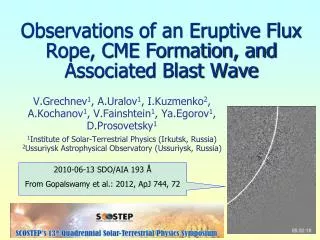
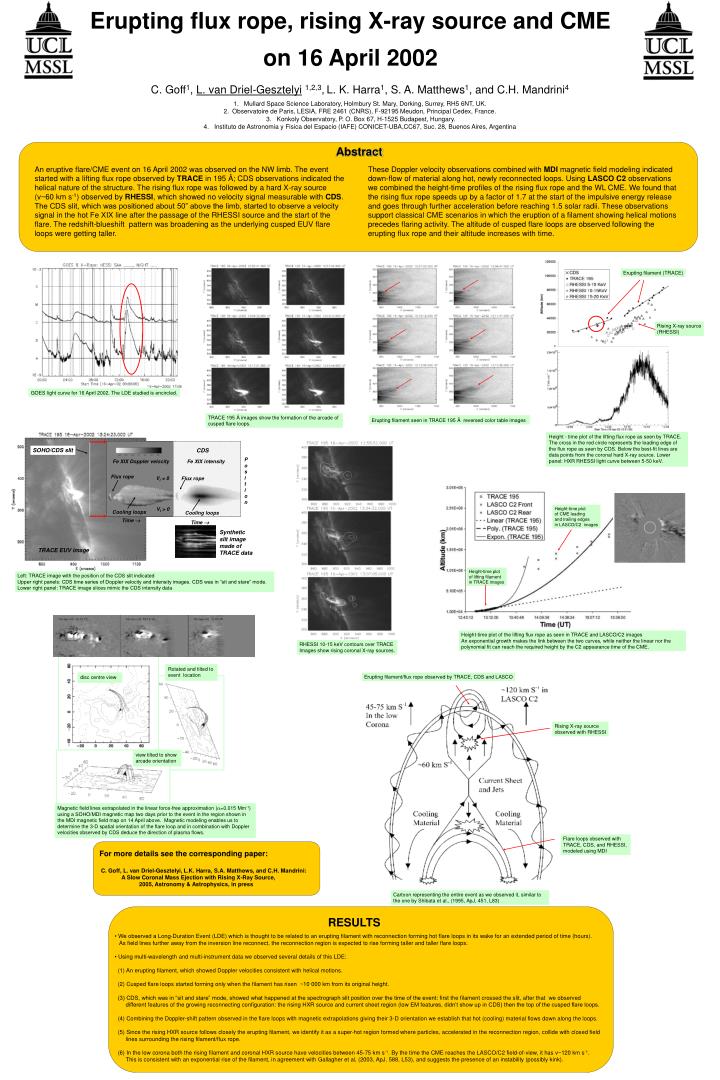
Abstract An eruptive flare/CME event on 16 April 2002 was observed on the NW limb. The event started with a lifting flux rope observed by TRACE in 195 Å; CDS observations indicated the helical nature of the structure. The rising flux rope was followed by a hard X-ray source (v~60 km s-1) observed by RHESSI, which showed no velocity signal measurable with CDS. The CDS slit, which was positioned about 50” above the limb, started to observe a velocity signal in the hot Fe XIX line after the passage of the RHESSI source and the start of the flare. The redshift-blueshift pattern was broadening as the underlying cusped EUV flare loops were getting taller. These Doppler velocity observations combined with MDI magnetic field modeling indicated down-flow of material along hot, newly reconnected loops. Using LASCO C2 observations we combined the height-time profiles of the rising flux rope and the WL CME. We found that the rising flux rope speeds up by a factor of 1.7 at the start of the impulsive energy release and goes through further acceleration before reaching 1.5 solar radii. These observations support classical CME scenarios in which the eruption of a filament showing helical motions precedes flaring activity. The altitude of cusped flare loops are observed following the erupting flux rope and their altitude increases with time. Erupting filament (TRACE) Rising X-ray source (RHESSI) TRACE 195 Å images show the formation of the arcade of cusped flare loops. Height - time plot of the lifting flux rope as seen by TRACE. The cross in the red circle represents the leading edge of the flux rope as seen by CDS. Below the best-fit lines are data points from the coronal hard X-ray source. Lower panel: HXR RHESSI light curve between 5-50 keV. Erupting filament seen in TRACE 195 Å reversed color table images Height-time plot of CME leading and trailing edges in LASCO/C2 images Height-time plot of lifting filament in TRACE images Left: TRACE image with the position of the CDS slit indicated Upper right panels: CDS time series of Doppler velocity and intensity images. CDS was in “sit and stare” mode. Lower right panel: TRACE image slices mimic the CDS intensity data Height-time plot of the lifting flux rope as seen in TRACE and LASCO/C2 images An exponential growth makes the link between the two curves, while neither the linear nor the polynomial fit can reach the required height by the C2 appearance time of the CME. RHESSI 10-15 keV contours over TRACE Images show rising coronal X-ray sources. Erupting filament/flux rope observed by TRACE, CDS and LASCO Rising X-ray source observed with RHESSI SOHO/CDS slit CDS Position Fe XIX Doppler velocity Fe XIX intensity Flux rope Vl < 0 Flux rope Vl > 0 Cooling loops Cooling loops Time Time Flare loops observed with TRACE, CDS, and RHESSI, modeled using MDI Rotated and tilted to event location Synthetic slit image made of TRACE data For more details see the corresponding paper: C. Goff, L. van Driel-Gesztelyi,L.K. Harra, S.A. Matthews, and C.H. Mandrini: A Slow Coronal Mass Ejection with Rising X-Ray Source, 2005, Astronomy & Astrophysics, in press disc centre view TRACE EUV image Cartoon representing the entire event as we observed it, similar to the one by Shibata et al., (1995, ApJ, 451, L83) RESULTS view tilted to show arcade orientation • We observed a Long-Duration Event (LDE) which is thought to be related to an erupting filament with reconnection forming hot flare loops in its wake for an extended period of time (hours). As field lines further away from the inversion line reconnect, the reconnection region is expected to rise forming taller and taller flare loops. • Using multi-wavelength and multi-instrument data we observed several details of this LDE: (1) An erupting filament, which showed Doppler velocities consistent with helical motions. (2) Cusped flare loops started forming only when the filament has risen ~10 000 km from its original height. (3) CDS, which was in “sit and stare” mode, showed what happened at the spectrograph slit position over the time of the event: first the filament crossed the slit, after that we observed different features of the growing reconnecting configuration: the rising HXR source and current sheet region (low EM features, didn’t show up in CDS) then the top of the cusped flare loops. (4) Combining the Doppler-shift pattern observed in the flare loops with magnetic extrapolations giving their 3-D orientation we establish that hot (cooling) material flows down along the loops. (5) Since the rising HXR source follows closely the erupting filament, we identify it as a super-hot region formed where particles, accelerated in the reconnection region, collide with closed field lines surrounding the rising filament/flux rope. (6) In the low corona both the rising filament and coronal HXR source have velocities between 45-75 km s-1. By the time the CME reaches the LASCO/C2 field-of-view, it has v~120 km s-1. This is consistent with an exponential rise of the filament, in agreement with Gallagher et al, (2003, ApJ. 588, L53), and suggests the presence of an instability (possibly kink). Magnetic field lines extrapolated in the linear force-free approximation (=0.015 Mm-1) using a SOHO/MDI magnetic map two days prior to the event in the region shown in the MDI magnetic field map on 14 April above. Magnetic modeling enables us to determine the 3-D spatial orientation of the flare loop and in combination with Doppler velocities observed by CDS deduce the direction of plasma flows. Erupting flux rope, rising X-ray source and CME on 16 April 2002 C. Goff1, L. van Driel-Gesztelyi1,2,3,L. K. Harra1, S. A. Matthews1, and C.H. Mandrini4 1. Mullard Space Science Laboratory, Holmbury St. Mary, Dorking, Surrey, RH5 6NT, UK. Observatoire de Paris, LESIA, FRE 2461 (CNRS), F-92195 Meudon, Principal Cedex, France. 3. Konkoly Observatory, P. O. Box 67, H-1525 Budapest, Hungary. 4. Instituto de Astronomia y Fisica del Espacio (IAFE) CONICET-UBA,CC67, Suc. 28, Buenos Aires, Argentina GOES light curve for 16 April 2002. The LDE studied is encircled.