Download
1 / 1
10 likes | 130 Views
CALIBRATION OF THE CLASS U3M 1D SOIL MOISTURE MODEL. Gonzalo M. Díaz and Moira E. Doyle Centro de Investigaciones del Mar y la Atmósfera (CIMA). CONICET/UBA. Summary

E N D
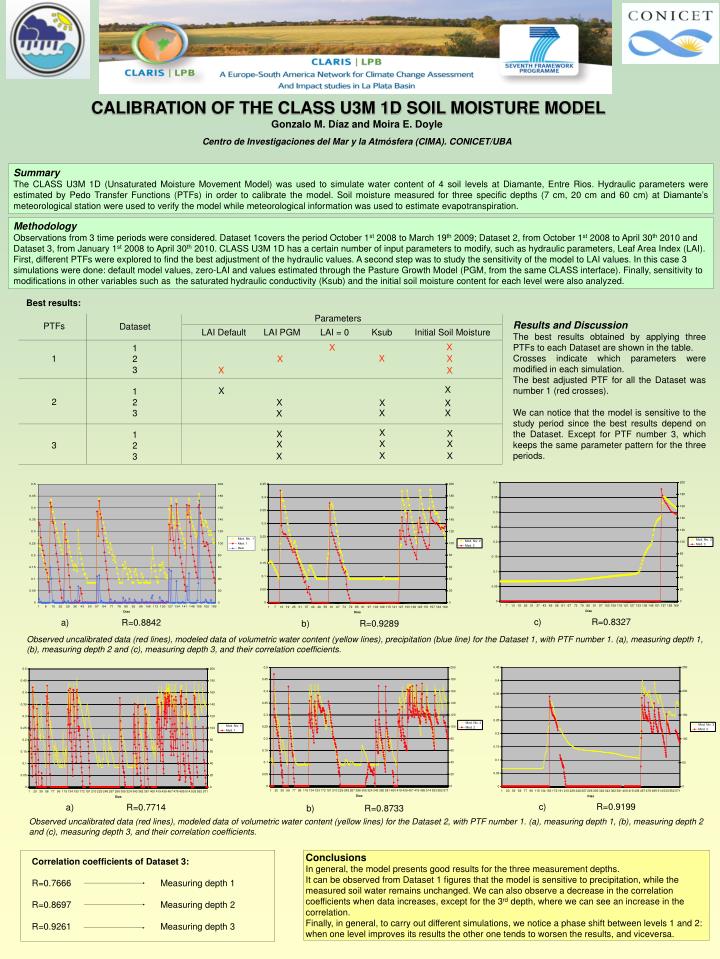
CALIBRATION OF THE CLASS U3M 1D SOIL MOISTURE MODEL Gonzalo M. Díaz and Moira E. Doyle Centro de Investigaciones del Mar y la Atmósfera (CIMA). CONICET/UBA Summary The CLASS U3M 1D (Unsaturated Moisture Movement Model) was used to simulate water content of 4 soil levels at Diamante, Entre Rios. Hydraulic parameters were estimated by Pedo Transfer Functions (PTFs) in order to calibrate the model. Soil moisture measured for three specific depths (7 cm, 20 cm and 60 cm) at Diamante’s meteorological station were used to verify the model while meteorological information was used to estimate evapotranspiration. Methodology Observations from 3 time periods were considered. Dataset 1covers the period October 1st 2008 to March 19th 2009; Dataset 2, from October 1st 2008 to April 30th 2010 and Dataset 3, from January 1st 2008 to April 30th 2010. CLASS U3M 1D has a certain number of input parameters to modify, such as hydraulic parameters, Leaf Area Index (LAI). First, different PTFs were explored to find the best adjustment of the hydraulic values. A second step was to study the sensitivity of the model to LAI values. In this case 3 simulations were done: default model values, zero-LAI and values estimated through the Pasture Growth Model (PGM, from the same CLASS interface). Finally, sensitivity to modifications in other variables such as the saturated hydraulic conductivity (Ksub) and the initial soil moisture content for each level were also analyzed. Best results: Parameters Results and Discussion The best results obtained by applying three PTFs to each Dataset are shown in the table. Crosses indicate which parameters were modified in each simulation. The best adjusted PTF for all the Dataset was number 1 (red crosses). We can notice that the model is sensitive to the study period since the best results depend on the Dataset. Except for PTF number 3, which keeps the same parameter pattern for the three periods. PTFs 1 2 3 Dataset 1 2 3 1 2 3 1 2 3 LAI Default LAI PGM LAI = 0 Ksub Initial Soil Moisture X X X X X X X X X X X X X X X X X X X X X X X X c) R=0.8327 a) R=0.8842 b) R=0.9289 Observed uncalibrated data (red lines), modeled data of volumetric water content (yellow lines), precipitation (blue line) for the Dataset 1, with PTF number 1. (a), measuring depth 1, (b), measuring depth 2 and (c), measuring depth 3, and their correlation coefficients. c) R=0.9199 a) R=0.7714 b) R=0.8733 Observed uncalibrated data (red lines), modeled data of volumetric water content (yellow lines) for the Dataset 2, with PTF number 1. (a), measuring depth 1, (b), measuring depth 2 and (c), measuring depth 3, and their correlation coefficients. Conclusions In general, the model presents good results for the three measurement depths. It can be observed from Dataset 1 figures that the model is sensitive to precipitation, while the measured soil water remains unchanged. We can also observe a decrease in the correlation coefficients when data increases, except for the 3rd depth, where we can see an increase in the correlation. Finally, in general, to carry out different simulations, we notice a phase shift between levels 1 and 2: when one level improves its results the other one tends to worsen the results, and viceversa. Correlation coefficients of Dataset 3: R=0.7666 Measuring depth 1 R=0.8697 Measuring depth 2 R=0.9261 Measuring depth 3