Download
1 / 24
240 likes | 406 Views
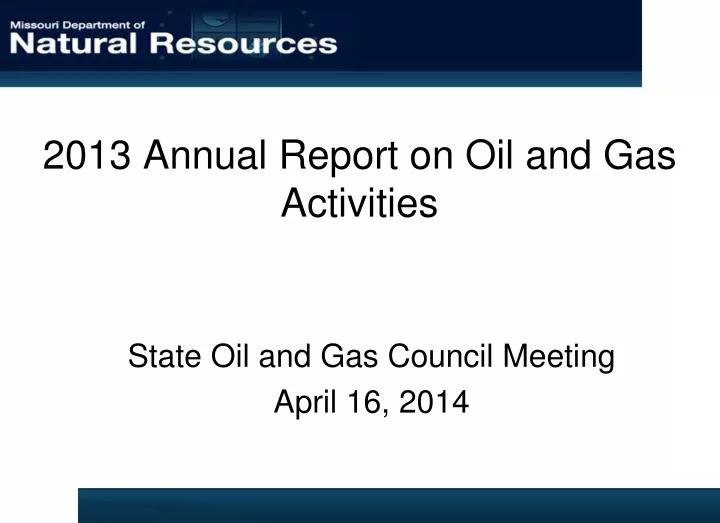
2013 Annual Report on Oil and Gas Activities. State Oil and Gas Council Meeting April 16, 2014. Missouri’s Oil Production in 2013. 601 active producing oil wells in 2013 200,566 barrels of oil produced Valued at about $17.7 million Price per barrel ranged $75.74 to $91.32

E N D
2013 Annual Report on Oil and Gas Activities State Oil and Gas Council Meeting April 16, 2014
Missouri’s Oil Production in 2013 • 601 active producing oil wells in 2013 • 200,566 barrels of oil produced • Valued at about $17.7 million • Price per barrel ranged $75.74 to $91.32 • Currently produced in six counties • 20 companies operated in 2013 • Currently 13 producing companies
Average Price for Missouri Oil • Average price per barrel in 2013 - $86.82 (↑~6%) (ranging from $75.74 to $91.32) • Average price per barrel in 2012 - $83.22 (↓~4%) (ranging from $69.07 to $94.22) • Average price per barrel in 2011 - $86.94 (↑~25%)(ranging from $71.28 to $102.61) • Average price per barrel in 2010 - $69.84 (↑~32%)(ranging from $58.66 to $81.02)
MISSOURI2013 Crude Oil Production By Operator(Operators Producing >1.0% of Production) bbls% of total • Kansas Res. Expl. & Dev.------ 82,055 (41.78%) • S&B Operating--------------------- 33,839 (17.24%) • Running Foxes Inc.--------------- 24,087 (12.01%) • Investment Equipment----------- 16,340 (8.46%) • Colt Energy, Inc.------------------- 13,542 (6.75%) • Laclede Gas Company----------- 12,002 (5.98%) • Laclede Oil Company------------- 9,728 (4.85%) • L.T Oil ---------------------------------- 2,872 (1.43%) • T-5 Leasing--------------------------- 2,852 (1.42%)
MISSOURI2013 Crude Oil Production By Operator(Operators Producing <1.0% of Production) bbls% of total • Palo Petroleum---------------------- 1,606 (0.83%) • Zero CO2------------------------------ 429 (0.20%) • AltaVista Energy-------------------- 429 (0.20%) • Encore --------------------------------- 150 (0.07%) • SCZ ------------------------------------- 64 (0.03%) • IGWT------------------------------------ 2 (0.001%) 2013 Total Crude Oil Production---------- 200,566 bbls
2013 Oil Producing Counties Vernon Co. 26,255 bbls (13%) $2,230.089 Atchison Co. 19,968 bbls(9%) $1,440,840 St. Louis Co. 22,731 bbls (10%) $1,993,748 Ray Co. 2 bbls (<.01%) Jackson Co. 16,937 bbls (8%) $1,504,465 Cass Co. 118,673 bbls(59%) $10,573,013 Total Production 200,556 bbls Total Value $17,706,158
Oil Producing Countiesand Known Fields Lange Field of St. Louis County
Cass Co. Missouri’s Top Oil Producing County • 118,673 bbls • 59% of the total oil produced in Missouri • Clark-Miller Oil Pool • Missouri’s Top • Oil Producing Pool • 115,894 bbls • 58% of total oil produced in Missouri
Oil Producing Countiesand Known Fields • In process of updating Oil and Gas Fields of Missouri, OFM-81-54-OG with plans for future posting on Oil & Gas web page • Clark-Miller Oil Pool, with council established boundaries, posted on Oil & Gas web page
Missouri’s CommercialGas Production in 2013 • 7 active producing commercial gas wells in 2013 • Over 8,777 MCF of gas produced • Valued at over $32,014 • Price per MCF averaged $3.65 • 86% in Vernon County, 14% in Clinton • 2 active company / 0 inactive
Missouri’s Private Gas Wells • 490 private gas wells • 54 are active • 34 are in Cass County • 436 wells with unknown status • Five (5) counties have Active private gas wells • Cass, Clay, Clinton, Platte and Jackson • Production reporting is exempted
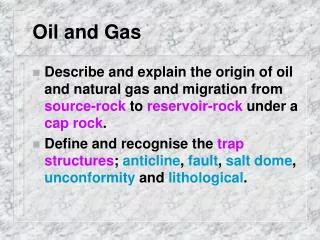
Class II Injection Wells • Wells that inject fluids in connection with oil/gas production • Disposal of produced salt water • Injection of gas as a liquid in a storage project • Injection of fluids for enhance recovery • Missouri has 576 Class II wells • Saline Water Disposal - 15 • Gas Storage – 54 (Technically UIC Class V Wells) • Enhanced Oil Recovery - 561
15 Saline Water Disposal Wells
54 Class V Gas Storage Wells
561 Enhanced Oil Recovery Wells 188 EOR Wells
2013 Permits Issued by DGLS • Cass Cnty. (207) 19 SCZ resources, LLC. 160 Kansas Resource Exploration & Development 17 S & B Operating, LLC 9 Town Oil Company 2 Running Foxes Petroleum, Inc. • Jackson Cnty. (34) 33 JTC Oil Company 1 Barbra A. Giblin Revocable Trust • Shelby Cnty. (4) 2 Baker, John Phillip 2 Buzzard, Warren, R • Vernon Cnty. (372) 6 Colt Energy, Inc. 306 Murchison Oil & Gas, Inc. 31 Palo Petroleum, Inc. 10Running Foxes Petroleum, Inc. 18 Zero-CO2, LLC 1 Epic Oil Extractors, LLC Total Permits - 617
Missouri Wells Plugged(oil/gas/injection/stratigraphic test) 2010 Wells Plugged 53 2011 Wells Plugged 34 • Wells Plugged 44 • Wells Plugged 348
Mechanical Integrity Tests & Lease Visits • MIT were performed on 190 wells total (188 injection wells) in 2013. • MGS staff witnessed 70 (37%) of all MIT conducted. • 10 lease visits were performed in 2013 • Prepped and plugged 0 abandoned wells with O&G remedial funds • The unit responded to over 1,546 oil/gas phone calls and inquiries during 2013.
Oil and Gas Remedial FundBalance on 03/1/14$11,851Total Bonding Held as of 03/19/14$1,611,009