Download
1 / 17
170 likes | 270 Views
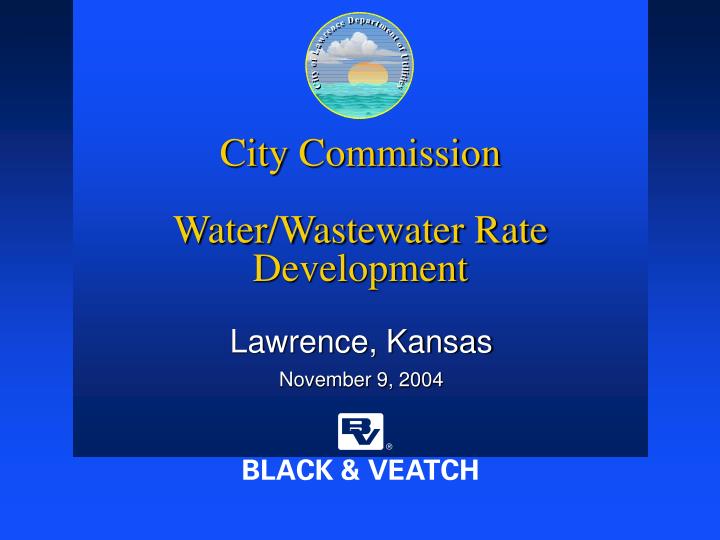
City Commission Water/Wastewater Rate Development. Lawrence, Kansas November 9, 2004. Capital Improvements Planning Process. Water/Wastewater Master Plans Develop Capital Improvement Plans Capital Improvement Plans Set Long Range Plan. Regulatory. Growth. Reliability.

E N D
City Commission Water/Wastewater Rate Development Lawrence, Kansas November 9, 2004
Capital Improvements Planning Process • Water/Wastewater Master Plans Develop Capital Improvement Plans • Capital Improvement Plans Set Long Range Plan Regulatory Growth Reliability
Rate Development Process Considers • Current Financial Condition • Capital Improvements Funding Needs Rates Are Then Established To • Solidify Financial Condition • Maintain Existing System • Fund Future Needs
Rate Development Philosophy All Rate Structures Developed are Based Upon Recovering The Cost Of Service While Meeting Debt Coverage Requirements
Existing Water/Wastewater Rates Capital Improvement Plans Developed Require Additional Revenue That Can Not Be Met with Existing Rates
Proposed Rate Modifications • Water System • Eliminate Minimum Charge • Initiate New System of Monthly Service Charges by Meter Size • Consider Alternative Volume Charges to Recover Costs of Service • Increase Required to Fund Capital Improvements Plan
Water Rate Alternatives Under Consideration • Uniform Volume Charge – Alternative 1 • Modified Declining Block – Alternative 2
Uniform Volume Charge (UVC) • Sets Rates For Each Customer Class • Residential • Multifamily • Commercial • Industrial • Favors Low To Moderate Volume Users In Each Class
Modified Declining Block (MDB) • Similar To Existing Rate Structure With New “Lifeline” Block For Lowest Volume Users • Favors Very Low And High Volume Users
Typical Residential UVCWater Bills – Table 2 2009 $/month Existing $/month 2005 $/month 2008 $/month Size/ Inches 2007 $/month Usage Mg 2006 $/month 1.95 4.73 7.51 13.07 18.63 29.75 43.65 57.55 85.35 140.95 279.95 Residential 5/8 5/8 5/8 5/8 5/8 5/8 5/8 5/8 5/8 5/8 5/8 0 1 2 4 6 10 15 20 30 50 100 6.55 6.55 6.55 11.59 16.63 26.71 39.31 51.91 71.11 109.51 205.51 1.95 4.62 7.29 12.63 17.97 28.65 42.00 55.35 82.05 135.45 268.95 2.10 4.99 7.88 13.66 19.44 31.00 45.45 59.90 88.80 146.60 291.10 2.20 5.19 8.18 14.16 20.14 32.10 47.05 62.00 91.90 151.70 301.20 2.25 5.37 8.49 14.73 20.97 33.45 49.05 64.65 95.85 158.25 314.25 Legend MDB Favorable Rate Over UVC Mg - 1,000 gallons
Typical Multifamily UVCWater Bills – Table 2 2009 $/month Existing $/month 2005 $/month 2008 $/month Size/ Inches 2007 $/month Usage Mg 2006 $/month 1.95 4.35 6.75 11.55 16.35 25.95 37.95 49.95 73.95 121.95 241.95 Multifamily 5/8 5/8 5/8 5/8 5/8 5/8 5/8 5/8 5/8 5/8 5/8 0 1 2 4 6 10 15 20 30 50 100 6.55 6.55 6.55 11.59 16.63 26.71 39.31 51.91 71.11 109.51 205.51 1.95 4.26 6.57 11.19 15.81 25.05 36.60 48.15 71.25 117.45 232.95 2.10 4.59 7.08 12.06 17.04 27.00 39.45 51.90 76.80 126.60 251.10 2.20 4.77 7.34 12.48 17.62 27.90 40.75 53.60 79.30 130.70 259.20 2.25 4.94 7.63 13.01 18.39 29.15 42.60 56.05 82.95 136.75 271.25 Legend MDB Favorable Rate Over UVC Mg - 1,000 gallons
TypicalCommercial/Industrial UVC Water Bills – Table 2 2009 $/month Existing $/month 2005 $/month 2008 $/month Size/ Inches 2007 $/month Usage Mg 2006 $/month Commercial 2 2 3 3 4 4 Industrial 3 3 4 6 110.40 216.90 438.00 651.00 1,080.00 2,145.00 400.00 594.00 4,865.00 9,722.00 50 100 200 300 500 1,000 200 300 2,500 5,000 115.26 211.26 421.96 613.96 1,005.96 1,895.96 421.96 613.96 4,565.96 9,034.96 106.40 208.90 422.00 627.00 1,040.00 2,065.00 388.00 576.00 4,715.00 9,422.00 115.10 226.10 456.50 678.50 1,125.50 2,235.50 418.50 621.50 5,090.50 10,173.00 119.20 234.20 473.00 703.00 1,166.00 2,316.00 435.00 646.00 5,291.00 10,573.00 123.90 243.40 491.00 730.00 1,211.50 2,406.50 449.00 667.00 5,466.50 10,924.00 Legend MDB Favorable Rate Over UVC Mg - 1,000 gallons
Typical Residential MDBWater Bills – Table 5 2009 $/month Existing $/month 2005 $/month 2008 $/month Size/ Inches 2007 $/month Usage Mg 2006 $/month 1.95 4.35 6.75 12.75 18.75 30.75 45.75 60.75 81.15 121.95 223.95 Residential 5/8 5/8 5/8 5/8 5/8 5/8 5/8 5/8 5/8 5/8 5/8 0 1 2 4 6 10 15 20 30 50 100 6.55 6.55 6.55 11.59 16.63 26.71 39.31 51.91 71.11 109.51 205.51 1.95 4.26 6.57 12.35 18.13 29.69 44.14 58.59 78.09 117.09 214.59 2.10 4.59 7.08 13.30 19.52 31.96 47.51 63.06 84.36 126.96 233.46 2.20 4.77 7.34 13.76 20.18 33.02 49.07 65.12 87.32 131.72 242.72 2.25 4.94 7.63 14.35 21.07 34.51 51.31 68.11 91.11 137.11 252.11 Legend UVC Favorable Rate Over MDB Mg - 1,000 gallons
Typical Multifamily MDBWater Bills – Table 5 2009 $/month Existing $/month 2005 $/month 2008 $/month Size/ Inches 2007 $/month Usage Mg 2006 $/month 1.95 4.35 6.75 12.75 18.75 30.75 45.75 60.75 81.15 121.95 223.95 Multifamily 5/8 5/8 5/8 5/8 5/8 5/8 5/8 5/8 5/8 5/8 5/8 0 1 2 4 6 10 15 20 30 50 100 6.55 6.55 6.55 11.59 16.63 26.71 39.31 51.91 71.11 109.51 205.51 1.95 4.26 6.57 12.35 18.13 29.69 44.14 58.59 78.09 117.09 214.59 2.10 4.59 7.08 13.30 19.52 31.96 47.51 63.06 84.36 126.96 233.46 2.20 4.77 7.34 13.76 20.18 33.02 49.07 65.12 87.32 131.72 242.72 2.25 4.94 7.63 14.35 21.07 34.51 51.31 68.11 91.11 137.11 252.11 Legend UVC Favorable Rate Over MDB Mg - 1,000 gallons
TypicalCommercial/Industrial MDB Water Bills – Table 5 2009 $/month Existing $/month 2005 $/month 2008 $/month Size/ Inches 2007 $/month Usage Mg 2006 $/month 123.90 225.90 438.00 642.00 1,053.00 1,998.00 438.00 642.00 4,833.00 9,565.00 Commercial 2 2 3 3 4 4 Industrial 3 3 4 6 50 100 200 300 500 1,000 200 300 2,500 5,000 115.26 211.26 421.96 613.96 1,005.96 1,895.96 421.96 613.96 4,565.96 9,034.96 119.04 216.54 419.64 614.64 1,007.64 1,912.64 419.64 614.64 4,627.64 9,159.64 128.96 235.46 456.86 669.86 1,098.86 2,093.86 456.86 669.86 5,078.86 10,061.36 139.26 254.26 492.86 722.86 1,186.36 2,266.36 492.86 722.86 5,506.36 10,913.86 133.72 244.72 475.52 697.52 1,144.52 2,189.52 475.52 697.52 5,324.52 10,556.52 Legend UVC Favorable Rate Over MDB Mg - 1,000 gallons
Proposed Rate Modifications • Wastewater System • Eliminate Minimum Charge • Initiate New Uniform Service Charge For All Customers • Increase Required to Fund Capital Improvements Plan
City Commission Water/Wastewater Rate Development Lawrence, Kansas November 9, 2004