1 / 25

2012 Elections and Public Opinion

2012 Elections and Public Opinion. Dan Nataf Director, Center for the Study of Local Issues Anne Arundel Community College www2.aacc.edu/csli. Center for the Study of Local Issues: Semi-annual survey. Conducted each March and October Involves 70+/- students as telephone interviewers

kamala
Download Presentation

2012 Elections and Public Opinion

An Image/Link below is provided (as is) to download presentation Download Policy: Content on the Website is provided to you AS IS for your information and personal use and may not be sold / licensed / shared on other websites without getting consent from its author. Content is provided to you AS IS for your information and personal use only. Download presentation by click this link. While downloading, if for some reason you are not able to download a presentation, the publisher may have deleted the file from their server. During download, if you can't get a presentation, the file might be deleted by the publisher.

E N D

Presentation Transcript


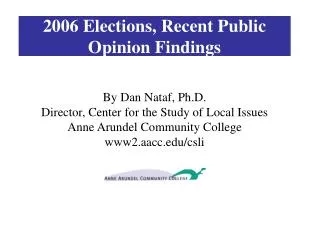
  1. 2012 Elections and Public Opinion Dan Nataf Director, Center for the Study of Local Issues Anne Arundel Community College www2.aacc.edu/csli

  2. Center for the Study of Local Issues:Semi-annual survey • Conducted each March and October • Involves 70+/- students as telephone interviewers • Contents: • Benchmark questions on the economy, most important problem, right/wrong direction, and demographics • Variable questions on current policy choices and major events

  3. Plan – focus on the election • What are current trends • Most important problem facing residents • Right/wrong direction • Perceptions of the economy • Economic circumstances • How are these trends related to choices for president and ballot/referenda items • Where are we in the election nationally • Discussion!

  4. Most Important Problem Taxes

  5. County: Right or Wrong Direction? Spring ‘99 to Fall ‘12

  6. Right/Wrong and Partisanship:% saying “Right”

  7. Obama Vote by Right/Wrong Direction: County, State and USA

  8. Economic Conditions Excellent + Good: Fall ‘06 to Fall ‘12

  9. Obama Vote by Perceptions of the Economy - County, State, USA

  10. Cost of living indicators: S ‘08-F ‘12

  11. Other economic indicators

  12. Obama Vote by Economic Circumstances – F ‘12

  13. Consumer Confidence: F ‘11 – F ‘12

  14. Obama Vote and Consumer confidence

  15. Obama Vote by Candidate Attributes

  16. Obama Vote by Demographics

  17. Presidential Job Approval

  18. Most important issue by candidate

  19. Ballot Items: Referenda

  20. Same Sex Marriage by Demographics

  21. Dream Act by Demographic Variables

  22. County Vote for President

  23. Washington Post/ABC Daily Tracking Poll

  24. Map of Battleground States NH Wis Iowa Ohio Nev. Va. Colo. NC Fl.

  25. Vote Estimates

More Related