Download
1 / 28
280 likes | 426 Views
THE NATURE OF PROCESS DESIGN. A Creative Activity !. The most effective way of communicating information about a process is through the use of flow diagrams. Block Flow Diagram (BFD) Process Flow Diagram (PFD) Piping and Instrumentation Diagram (P&ID). Mixed Gas (2,610 kg/h). Toluene

E N D
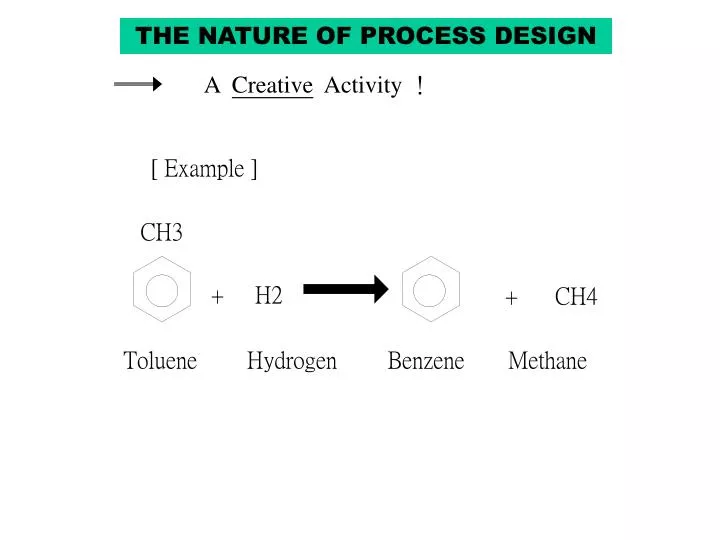
THE NATURE OF PROCESS DESIGN A Creative Activity !
The most effective way of communicating information about a process is through the use of flow diagrams. • Block Flow Diagram (BFD) • Process Flow Diagram (PFD) • Piping and Instrumentation Diagram (P&ID)
Mixed Gas (2,610 kg/h) Toluene (10,000 kg/h) Reactor Gas Separator Benzene (8,210 kg/h) Hydrogen (820 kg/h) Conversion 75% Toluene Mixed Liquids Toluene Reaction : C7H8 + H2 = C6H6 + CH4 Figure 1.1 Block flow process diagram for the production of benzene Toluene and hydrogen are converted in a reactor to produce benzene and methane.The reaction does not go to completion, and excess toluene is required. The noncondensable gases are separated and discharged. The benzene product and the unreacted toluene are then separated by distillation. The toluene is then recycled back to the reactor and the benzene removed in the product stream.
Table 1.1 Conventions and Format Recommended for Laying out a Block Flow Process Diagram 1. Operations shown by blocks. 2. Major flow lines shown with arrows giving direction of flow. 3. Flow goes from left to right whenever possible. 4. Light stream (gases) toward top with heavy stream (liquids and solids) toward bottom. 5. Critical information unique to process supplied. 6. If lines cross, then the horizontal line is continuous and the vertical line is broken. 7. Simplified material balance provided.
Process Flow Diagram (PFD) A PFD includes the following items: 1. major equipments; 2. principal flow route and control involved from raw material feed to final product; 3. key temperature and pressure corresponding to anticipated normal operation; 4. material flow rates and compositions; 5. design duties and sizes of major equipments.
Table 1.2 Conventions Used for Identifying Process Equipment Process Equipment General Format XX-YZZA/B XXare the identification letters for the equipment classification C - Compressor or Turbine E - Heat Exchanger H - Fired Heater P - Pump R - Reactor T - Tower TK - Storage Tank V - Vessel Y designates an area within the plant ZZ are the number designation for each item in an equipment class A/B identifies parallel units or backup units not shown on a PFD Supplemental Information Additional description of equipment given on top of PFD
Table 1.3 Conventions for Identifying Process and Utility Streams Process Streams All conventions shown in Table 1.1 apply. Diamond (square) symbol located in flow lines. Numerical identification (unique for that stream) inserted in diamond (square). Flow direction shown by arrows on flow lines. Utility Streams lps Low Pressure Steam: 3-5 barg (sat)‡ mps Medium Pressure Steam: 10-15 barg (sat)‡ hps High Pressure Steam: 40-50 barg (sat)‡ htm Heat Transfer Media (Organic): to 400C cw Cooling Water: From cooling tower 30C returned at less than 45C+ wr River Water: From river 25C returned at less than 35C rw Refrigerated Water: In at 5C returned at less than 15C rb Refrigerated Brine: In at -45C returned at less than 0C cs Chemical Waste Water with high COD ss Sanitary Waste Water with high BOD, etc. el Electric Heat (specify 220, 440, 660V service) ng Natural Gas fg Fuel Gas fo Fuel Oil fw Fuel Water ‡These pressure are set during the preliminary design stages and typical values vary within the ranges shown. +Above 45C, significant scaling occurs.
Table 1.4 Information Provided in a Flow Summary Essential Information Stream Number Temperature (C) Pressure (bar) Vapor Fraction Total Mass Flow Rate (kg/h) Total Mole Flow Rate (kmol/h) Individual Component Flow Rates (kmol/s) Optional Information Component Mole Fractions Component Mass Fractions Individual Component Flow Rates (kg/h) Volumetric Flow Rates (m3/h) Significant Physical Properties Density Viscosity Other Thermodynamic Data Heat Capacity Stream Enthalpy K-values Stream Name
Table 1.6 Equipment Descriptions for PFD and P&IDs Equipment Type Description of Equipment Towers Size (height and diameter), Pressure, Temperature Number and Type of Trays Height and Type of Packing Materials of Constructions Heat Exchangers Type: Gas-Gas, Gas-Liquid, Liquid-Liquid, Condenser, Vaporizer Process: Duty, Area, Temperature, and Pressure for both streams. No. of shell and Tube Passes Materials of Construction: Tubes and Shell Tanks See vessels Vessels Hight, Diameter, Orientation, Pressure, Temperature, Materials of Construction Pumps Flow, Discharge Pressure, Temperature, P, Driver Type, Shaft Power, Materials of Construction Compressors Actual Inlet Flow Rate, Temperature, Pressure, DrverType, Shaft Power, Materials of Construction Heaters (fired) Type, Tube Pressure, Tube Temperature, Duty, Fuel, Material of Construction Others Provide Critical Information
Piping and Instrumentation Diagram (P&ID) 1. All process equipments and pipings required for start-up, shut-down, emergency and normal operation of the plant, including valves, blinds, etc. 2. An id number, an identifier of the material of construction, diameter and insulation requirements for each line. 3. Direction of flow. 4. Identification of main process and start-up lines. 5. All instrumentation, control and interlock facilities with indication of action on instrument air failure. 6. Key dimensions or duties of all equipments. 7. Operating and design pressures and temperatures for vessels and reactors. 8. Equipment elevations. 9. Set pressure for relief valves. 10.Drainage requirements. 11.Special notes on piping configuration as necessary, e.g. “gravity drainage.”
Table 1.8 Exclusions from Piping and Instrumentation Diagram 1. Operating conditions T,P 2. Stream flows 3. Equipment locations 4. Pipe routing a. Pipe lengths b. Pipe fittings 5. Supports, structures, and foundations
Table 1.9 Conventions in Constructing Piping and Instrumentation Diagrams For Equipment - Shown Every Piece Including Spare units Parallel units Summary details of each unit For Piping - Include All Lines Including Drains, Sample Connections and Specify Size (use standard sizes) Schedule (thickness) Materials of construction Insulation (thickness and type) For Instruments - Identify Indicators Recorders Controllers Show instrument lines For Utility - Indentify Entrance utilities Exit utilities Exit to waste treatment facilities
Activities of Process Design (1)Synthesis The step where one conjectures the building blocks and their interconnections to create a structure which can meet the stated design requirements. (2)Analysis (Simulation) The activity of modeling and then solving the resulting equations to predict how a selected structure should behave if it were constructed. (3)Evaluation The activity of placing a worth on the structure where the worth might be its cost, its safety, or its net energy consumption. (4)Optimization The systematic searching over the allowed operating conditions to improve the evaluation as much as possible. Parameter structure
Process Synthesis A design task where one conjectures the building blocks and their interconnectionsto create a structure which can meet the stated design requirements.
Figure 1.1 Synthesis is the creation of a process to transform feed streams into product streams. Simulation predicts how it would behave if it was constructed.
Figure 1.6 The “onion model” of process design. A reactor design in needed before the separation and recycle system can be designed, and so on. (From Smith and Linnhoff, Trans. IChemE, ChERD, 66:195, 1988; reproduced by permission of the Institution of Chemical Engineers.) Reactor Separation and Recycle System Heat Exchanger Network Utilities
A HIERARCHICAL APPROACH Toluene + H2 Benzene + CH4 2 Benzene Diphenyl + H2 1150 F ~ 1300 F 500 psia
Toluene feed ENERGY INTEGRATION
ALTERNATIVES OF DISTILLATION TRAIN (1) Recycle Diphenyl (2) (3)
ALTERNATIVES OF VAPOR RECOVERY SYSTEM (1) Condensation; (2) Absorption; (3) Adsorption; (4) Membrane.
Vapor recovery system Purge H2 , CH4 H2 , CH4 Reactor system Phase split Toluene Benzene Liquid separation system Dipheny1 Simplified Flowsheet for the Separation System
Gas recycle Purge H2 , CH4 Benzene H2 , CH4 Reactor system Separation system Toluene Dipheny1 Toluene recycle Recycle Structure of the Flowsheet
Purge H2 , CH4 H2 , CH4 Benzene Toluene Dipheny1 Input-Output Structure of the Flowsheet